Flash Alert: Monday 25th November
A recap of the month and a clarification of our views
Around one month ago we saw the price of BTCUSDT rally sharply from a low of $7,361 to $10,370 following a short squeeze that was instigated by upbeat comments made by Chinese Premier Xi Jinping.
The announcment regarding China ‘seizing the opportunity‘ to advance the development of blockchain technologies had sparked a rally, which saw the price of Bitcoin defying the 200-day moving average and briefly settling above the psychological $10,000 level.
The sharp move had caught the bears totally by surprise, including ourselves. Whether by coincidence or not, this all happened at the same time a death cross had appeared on the charts.
A death cross occurs when the short-term 50-day simple moving average crosses through the long-term 200-day simple moving average from above towards the downside. It is a bearish signal that is usually followed by a series of further pronounced price declines (and in retrospect, the bearish crossover has proven to be accurate even with Bitcoin).
These sometimes inexplicable events forced us to reassess the risk/reward tradeoff of taking a short-term view on Bitcoin. We concluded it is more simple and attractive to be considering a longer-term view on Bitcoin at the current price point, and therefore altered our bearish view to a bullish one.
Our log price analysis had derived a potential bottom ranging between $6,000-$5,000 for BTCUSDT and a potential top anywhere between $22,000 – $162,754 following the post-halving period in May 2020.
In that report, we had also observed that Bitcoin could be experiencing a bullish consolidation following an overshooting period that appeared to occur at the beginning of what appears to be a bull-market mega cycle (seemingly commencing in Q2 of 2019, around one year prior to the May 2020 halvening).
Separately, our hash rate analysis indicated the price of Bitcoin could be valued at $14,791 or $16,432 based on a hash rate of 90M and 100M respectively.
If the observations in our analysis do indeed pan out and the bottom for Bitcoin does happen to be $5,000, then the downside opportunity from a current market price of $7,150 is equivalent to $2,150.
Conversely, the upside upside could equate to anywhere between $7,641 – $155,604 (or perhaps even more) based on the current market price of $7,150.
The upside potential for any asset class is theoretically unlimited whereas the downside is limited to nil (barring the use of leverage of course).
At the same time we acknowledge the underlying assumptions of our research are far from perfect and could break down since they are predominantly based on historical patterns being repetitve. Bitcoin is afterall experiencing the worst pre-halvening price performance in its history – so far. If you don’t believe us, have a closer look at the table here and do your own math.
Correlations break down over time and therefore, as the popular saying goes “past performance is not an indicator of future performance.”
However, even if we had to take a binary approach to Bitcoin and assume the price could fall to nil, then the potential downside (or gain if you’re shorting) would be $7,137 per BTC in this scenario. Converseley, the potential upside based on our research could be anywhere from $7,654 – $155,617 (or more) per BTC.
The point we want our audience to start thinking about at this juncture is that the upside potential for Bitcoin is increasingly becoming attractive at current levels – and even more so as the price declines futher from here.
However, the level of attractivness really depends on whether you believe Bitcoin will remain a viable crypto over the long run.
There are many Bitcoin critics who question its lack of adoption and use cases as well as its inability to scale as rapidly as other cryptos. Whilst there is some truth to these views, we believe it is also a fairly static perspective. We also point out that Bitcoin is currently the only crypto that has had any meaningful traction among institutional investors – and that traction continues to grow.
Bottom line, Bitcoin has fallen to an interesting price point that merits further thought about the risk/reward dynamics of being a HODLER versus a short-term trader.
So where is Bitcoin heading to next?
The trend is your friend
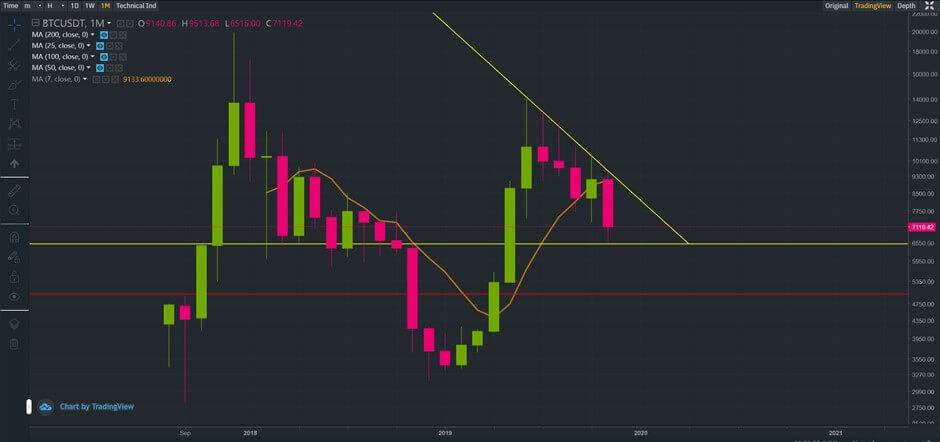
The monthly chart (above) for BTCUSDT clearly shows an overarching bearish trend with the price encountering resistance at the 7-period moving average.
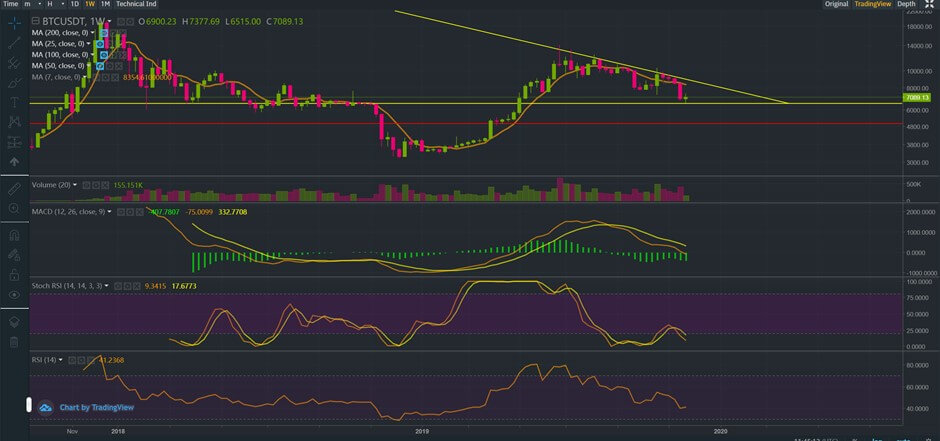
The weekly chart (above) for BTCUSDT confirms the trend remains bearish with both the 50 and 100-period simple moving averages currently acting as a barrier for further gains. The MACD and RSI indicators on the chart also lend support to the bearish view.
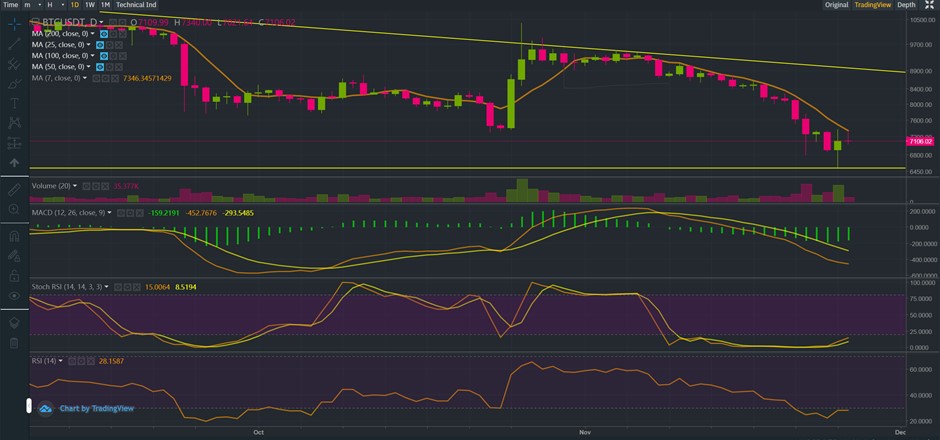
The daily chart (above) for BTCUSDT clearly shows the price struggling to breach the 7-day simple moving average despite the 14-day RSI and Stochastic RSI emitting strong oversold signals.
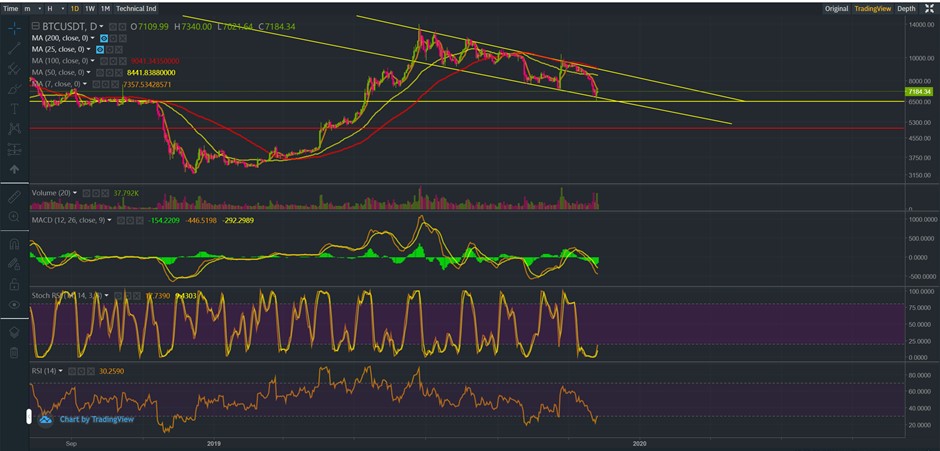
Furthermore, the daily chart (above) clearly illustrates the price of Bitcoin trading within a bearish descending channel, with the low of $6,515 potentially acting as the pivotal floor, which if broken, is likely to see Bitcoin in a precipitous fall towards $5,000.
Despite the oversold RSI’s, we are noticing an absence of strong momentum behind the current price bounce as strong resistance at the short-term 7-day moving average of $7,350 acts as a barrier. These conditions could imply Bitcoin is gearing up for an even sharper decline from current levels.
At the time of writing, the price of BTCUSDT was trading at around $7,150, up from an earlier intra-day low of $7,021 and down from an earlier high of $7,340.
As per our previous updates, we remind our audience that we do not have a crystal ball. We attempt to apply a combination of mathematics, fundamental and technical analysis to our updates to provide you with fresh and unique insights although at the end of the day there are no guarantees.
We reiterate that our derived price scenarios for Bitcoin may not pan out and therefore we warn our growing audience to tread very carefully and their own risk. Bitcoin is very risky (as you must all know by now) and past performance is not always indicative of the future.
If you enjoy reading our updates and analysis then start following us on Twitter.
A follow up is available here.
Anyone interested in reading our previous updates may do so here as they remain valid and provide a good trail for anyone wanting to catch up.
If you’re thinking about trading bitcoin then visit our bitcoin price analysis page. Here we periodically provide interesting bitcoin price insights and analyses that every crypto trader and investor should be aware of.
