Disclaimer: All of the content written on CoinMarketExpert is unbiased and based on objective analysis. The information provided on this page should not be construed as an endorsement of cryptocurrency, a service provider or offering and should neither be considered a solicitation to buy or trade cryptocurrency. Cryptocurrencies carry substantial risk and are not suitable for everyone. See further disclaimer at the bottom of the page.
The challenge: construct a portfolio of cryptocurrencies that consistently outperforms Bitcoin
We seem to come across many who only ever invest in Bitcoin. After all, Bitcoin’s halving is just around the corner and historically it has proven to be a very bullish period for the price, so why would anyone even consider investing in altcoins at this juncture (unless those projects hit major milestones of course)?
Perhaps there is some merit in considering certain altcoins during a Bitcoin bull market. On many occasions, we have observed a pickup in the price of Bitcoin acting almost like a risk appetite barometer for the wider cryptocurrency market, with certain cryptocurrencies even exhibiting outsized returns during periods when the price of Bitcoin was rising.
So, is it possible to construct a portfolio of cryptocurrencies that have a higher volatility than Bitcoin? Under such conditions, could a portfolio of high beta cryptocurrencies reliably outperform the price performance of Bitcoin during a bull market? Would it be consistent? and how would that portfolio fare if Bitcoin resumed a downtrend?
With all of these interesting questions, we set off on a journey to find the right combo of cryptocurrencies that when held together with Bitcoin in a portfolio could consistently help increase returns during an upturn and decrease losses during a downturn.
With this challenge accepted, we will run you through the thought process we had and the exciting results that we stumbled upon, so keep reading!
The methodology
The process for selecting the altcoins to construct a Bitcoin-beating portfolio had to be unbiased and based on mathematical reasoning.
The selection process
In order to obtain a decent representation of the altcoin market, we selected the 15 largest cryptocurrencies by market capitalisation, as of 29th January 2020.
We felt the following cryptocurrencies were sufficiently large, capitalised and renown. The selection consisted of the following:
- Ethereum (ETH)
- Ripple (XRP)
- Bitcoin Cash (BCH)
- Litecoin (LTC)
- EOS (EOS)
- Binance Coin (BNB)
- Ethereum Classic (ETC)
- Cardano (ADA)
- Tron (TRX)
- Stellar (XLM)
- Monero (XMR)
- Dash (DASH)
- ChainLink (LINK)
- NEO (NEO)
- IOTA (MIOTA)
Cross Correlation Analysis
Over the past, we have observed many periods when the price of certain altcoins rose (or fell) during the same period when the price of Bitcoin was rising or falling. We Therefore began to examine this observation more closely by applying a cross-correlation analysis of the daily returns of Bitcoin versus the above selection.
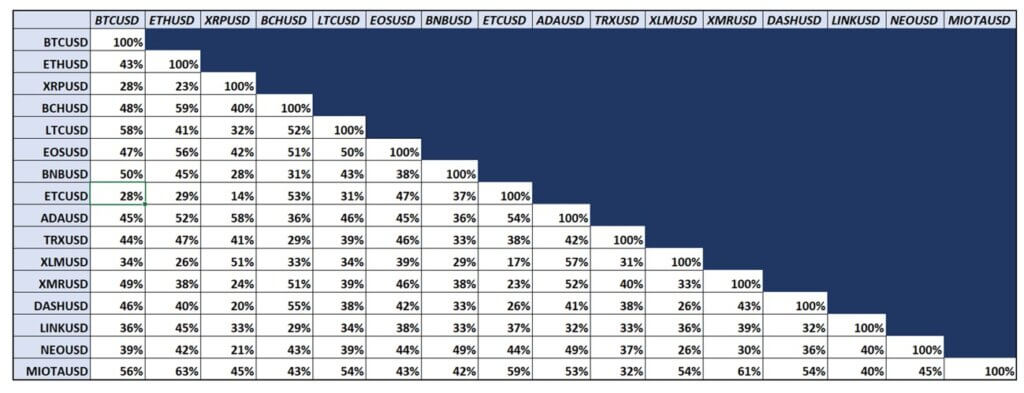
In the table above we calculated the cross-correlations of the daily returns (over a 5-year period) for Bitcoin and the 15 cryptocurrencies in our selection.
Correlation coefficients can range from -1.00 (-100%) to +1.00 (+100%). The value -1.00 (-100%) represents a perfect negative correlation, which means that as the value of one variable increases, the other decreases. Conversely, the value of +1.00 (+100%) represents a perfect positive correlation, meaning that as one variable increases in value, so does the other.
The analysis indicates that the price performance of Bitcoin and the altcoin market is positively correlated.
However, the correlation coefficients among certain cryptocurrency pairs were low. For example, the cross-correlation coefficient between BTCUSD and ETCUSD over the 5 year period was only 28% (or 0.28).
The fact that correlations were not perfectly positive is actually encouraging since it suggests that portfolio diversification benefits could exist.
Low positive correlations between Bitcoin and certain cryptocurrencies suggests portfolio diversification benefits may exist.
Rolling Cross Correlation Analysis
From the 5-year cross-correlation analysis, we understood there is a positive correlation among the cryptocurrencies within our selection. But do these correlations change over time?
Certain projects in our selection did not even have a listed coin 5 years ago, so we developed a 14-day rolling cross-correlation analysis beginning from October 2017, when complete price data for all of the cryptocurrencies in our analysis was available.
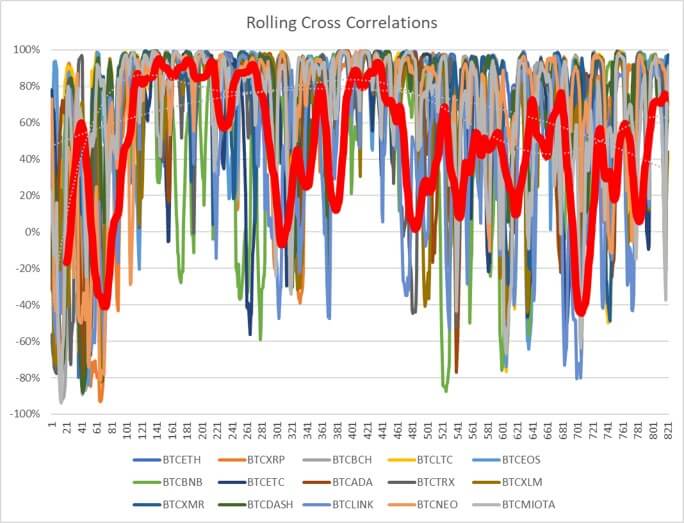
The chart above shows the 14-day rolling cross-correlation of daily returns between Bitcoin and the 15 cryptocurrencies in our selection. From October 2017 to January 2020, there were over 821 observations, which we felt is sufficient to derive an opinion.
This analysis shows the rolling correlations rising and falling over time, with correlations swinging between being nearly perfectly positive to almost perfectly negative on certain periods.
In order to simplify the above observation, we took the average correlation coefficient for each of the 15 cryptocurrencies between October 2017 and January 2020 and plotted it together with the price of Bitcoin. The result may be seen in the chart below.
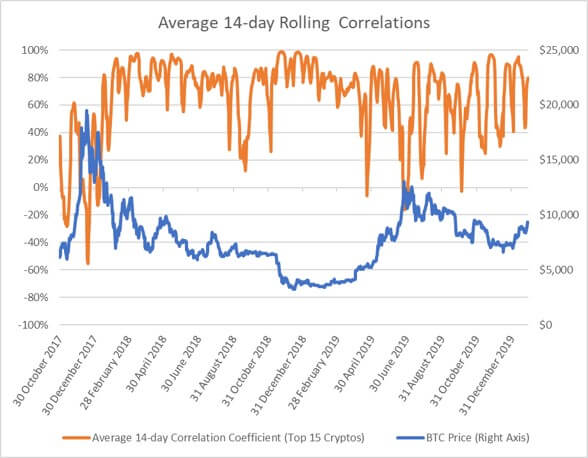
The chart (above) helps to add some context to the correlation swings seen in the previous chart. It illustrates that the average correlation coefficient of returns (of the top 15 cryptocurrencies within our selection versus Bitcoin) tends to become negatively correlated around the time when the price of Bitcoin reaches a cycle peak.
In other words, around the time when the price of Bitcoin reaches a cycle peak, there are money flows that are either going into (or out of) Bitcoin and at the same time, out of (or into) altcoins.
Perhaps investors who may have made money on Bitcoin’s rising price could be taking profits around cycle peak and moving into seemingly undervalued altcoins, causing a negative correlation of returns?
Or maybe altcoin investors could be taking profits and increasing their exposure to Bitcoin during the late price cycle due to FOMO “Fear Of Missing Out” that pushes Bitcoin into a deeper bubble (that eventually causes a correction)?
These are very interesting observations although we need to be aware that correlations do not imply causation. The key point nonetheless remains consistent. The presence of changing correlations suggests that portfolio diversification benefits do exist.
So the next question is, how do we go about selecting the cryptocurrencies to place into a portfolio that is capable of delivering consistent outperformance versus Bitcoin. Is it even possible?
Regression analysis: the birth of a crypto beta
In investment analysis and corporate finance, there is the concept of Beta, which simply measures how volatile an individual stock is versus market risk. The textbook formula for beta is as follows:
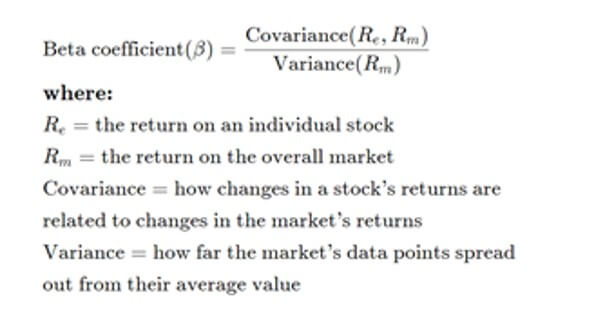
Don’t get too caught up with the complicated-looking formula. This is what you should know about beta, nonetheless:
1. If a stock has a beta equal to 1, it means the stock’s price tends to move with the market.
2. A beta that is greater than 1 indicates that the stock’s price is more volatile than the market. For example, a beta coefficient of 1.2 indicates that the stock’s price is 20% more volatile than the market.
3. Conversely, a beta coefficient that is less than 1 means the stock price tends to be less volatile than the market.
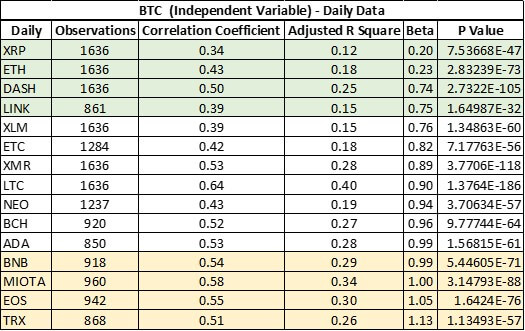
Applying the same logic to cryptocurrencies, we calculated a hypothetical beta for every cryptocurrency in our selection, regressing the daily natural log-returns of each cryptocurrency (dependent variable) with those of Bitcoin (the independent variable) for as far as we could go back using both daily returns and weekly returns.
The objective of this tedious exercise was to help us understand how volatile the returns of each cryptocurrency is relative to the returns of Bitcoin; so if Bitcoin rises by 1%, then how much would the price of Binance coin move on average…etc?
By understanding these dynamics, we could add certain cryptocurrencies to a portfolio consisting of Bitcoin to create a supercharged portfolio (that could even outperform the solo returns of Bitcoin in a bull market).
So we computed the Beta coefficients using daily returns data as well as weekly returns for Bitcoin versus the 15 cryptocurrencies within our selection.
Table 1, below, shows the regression outputs for the daily data.
Whilst Table 2, below, shows the regression outputs for the weekly data.
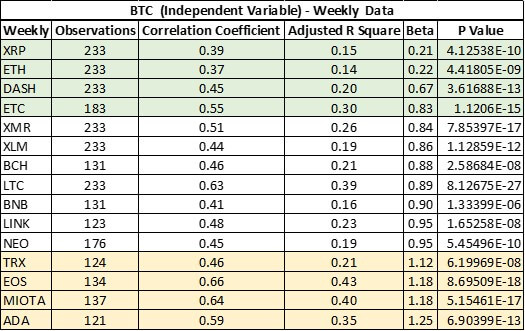
It is interesting to point out that Table 1 and 2 show a high degree of consistency in the outputs for daily and weekly data.
Interestingly, the data indicates there is no statistically significant relationship between the returns of Bitcoin and the returns of the 15 cryptocurrencies in our selection.
This is great news for anyone wanting to create a diversified portfolio of crytocurrencies.
How we created a portfolio of cryptocurrencies that consistently outperforms Bitcoin
We colour coded Table 1 and 2, above, and segmented the data for the 15 cryptocurrencies into 3 portfolios, selecting five cryptocurrencies that had the Lowest beta coefficients from the daily and weekly data sets. Then we selected the top five cryptocurrencies that had the Highest beta coefficients. Everything else was assigned to Middle Beta Portfolio. The compositions are clearly shown below:
Lowest Beta Portfolio
- Ethereum (ETH)
- Ripple (XRP)
- Dash (DASH)
- Ethereum Classic (ETC)
- ChainLink (LINK)
Highest Beta Portfolio
- Tron (TRX)
- EOS (EOS)
- IOTA (MIOTA)
- Cardano (ADA)
- Binance Coin (BNB)
Middle Beta Portfolio
- Bitcoin Cash (BCH)
- Litecoin (LTC)
- Stellar (XLM)
- Monero (XMR)
- NEO (NEO)
We then assigned equal weights to each cryptocurrency within the 3 different portfolios:
Lowest Beta Portfolio (Equal Weight)
- Ethereum (ETH) – 20%
- Ripple (XRP) – 20%
- Dash (DASH) – 20%
- Ethereum Classic (ETC) – 20%
- ChainLink (LINK) – 20%
Highest Beta Portfolio (Equal Weight)
- Tron (TRX) – 20%
- EOS (EOS) – 20%
- IOTA (MIOTA) – 20%
- Cardano (ADA) – 20%
- Binance Coin (BNB) – 20%
Middle Beta Portfolio (Equal Weight)
- Bitcoin Cash (BCH) – 20%
- Litecoin (LTC) – 20%
- Stellar (XLM)- 20%
- Monero (XMR)- 20%
- NEO (NEO) – 20%
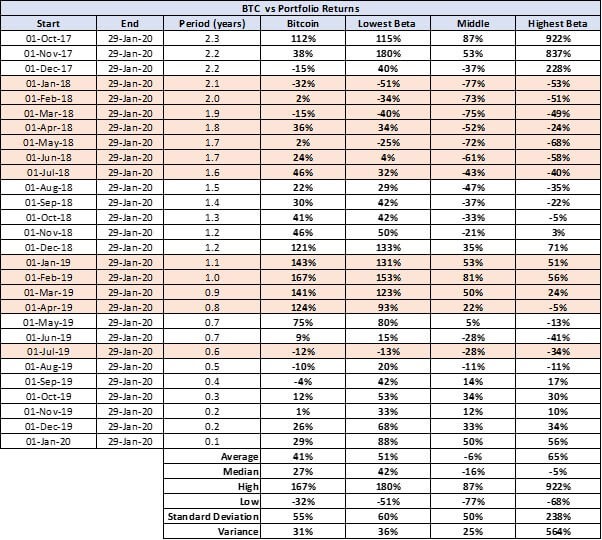
Following the equal weighting, we computed the returns for the Lowest, Middle and Highest Beta Portfolios from 1st October 2017 to 29th January 2020, and compared those returns with those for Bitcoin during the same period, as illustrated in Table 3, below.
Highest Beta Portfolio Performance vs Bitcoin
We found that the portfolio with the “Highest Beta” materially outperformed the price performance of Bitcoin, soaring 922% vs 112% for Bitcoin between 1st October 2017 until 29th January 2020.
As we expected, the cryptocurrencies with the “Highest Beta” in our sample provided the highest returns, although that was only true for a specific period in time. Beyond Q4 2017 there was no consistency.
For example, from Table 3 we may see that an investment in the “Highest Beta” portfolio from 1st July 2018 to 29th January 2020, would have yielded a loss of 40% whereas investing in Bitcoin over the same period would have yielded a gain of 46%.
Based on these observations, the “Highest Beta” portfolio is too risky and unpredictable for us to consider being useful in practice.
Lowest Beta Portfolio Performance vs Bitcoin
We observed that the “Lowest Beta” portfolio had actually outperformed the “Highest Beta” portfolio as well as Bitcoin on many more occassions, which is very interesting.
Middle Beta Portfolio Performance vs Bitcoin
We also observed that the “Middle Beta” portfolio had shown great consistency by underperforming the “Highest Beta” and “Lowest Beta” portfolios on most occasions, which is extremely exciting. We are now beginning to obtain a hint of statistical significance.
Does adding Bitcoin to the three portfolios improve the returns?
The next thing we did was include Bitcoin to the “Lowest Beta“, “Middle Beta” and “Highest Beta” portfolios to see whether there was any improvement, whilst maintaining an equal weight:
Lowest Beta Portfolio Composition (Equal Weight)
- Bitcoin (BTC) – 16.666%
- Ethereum (ETH) – 16.666%
- Ripple (XRP) – 16.666%
- Dash (DASH) – 16.666%
- Ethereum Classic (ETC) – 16.666%
- ChainLink (LINK) – 16.666%
Highest Beta Portfolio Composition (Equal Weight)
- Bitcoin (BTC) – 16.666%
- Tron (TRX) – 16.666%
- EOS (EOS) – 16.666%
- IOTA (MIOTA) – 16.666%
- Cardano (ADA) – 16.666%
- Binance Coin (BNB) – 16.666%
Middle Beta Portfolio Composition (Equal Weight)
- Bitcoin (BTC) – 16.666%
- Bitcoin Cash (BCH) – 16.666%
- Litecoin (LTC) – 16.666%
- Stellar (XLM)- 16.666%
- Monero (XMR)- 16.666%
- NEO (NEO) – 16.666%
What we observed from Table 4 (below) is that there are minor improvements in the overall return and risk profile for the “Lowest Beta” and “Highest Beta” portfolios.
The “Lowest Beta“ portfolio also saw a decrease in the number of underperforming periods versus Bitcoin, as highlighted in red in both Table 3 (above) and Table 4 (below).
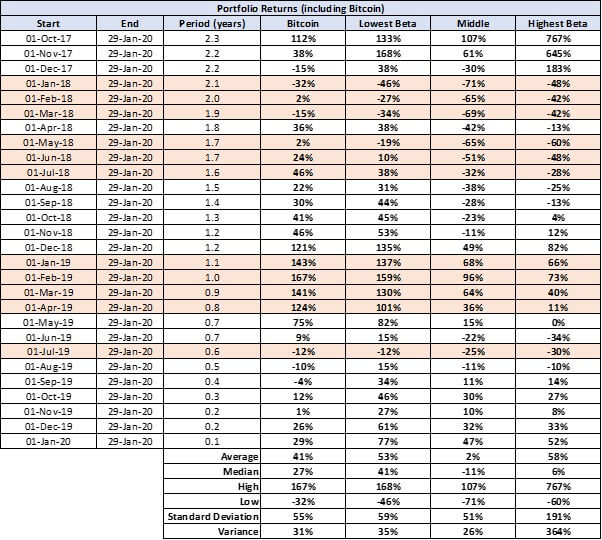
This analysis indicates that by adding Bitcoin to a portfolio of cryptocurrencies, we can reduce volatility risk and maximise returns. Therefore there is still hope that we can develop a portfolio that consistently outperforms the price performance of Bitcoin during bull markets and bear markets!
Optimising the portfolio weights to construct a portfolio of cryptocurrencies that consistently outperforms Bitcoin
So the next thing we did was build on our previous observations. We took the “Lowest Beta“, “Middle Beta” and “Highest Beta “portfolios that included Bitcoin in their composition, and tweaked the weights through a simulation analysis until the most optimal outcome was derived.
The optimal composition we identified is as follows:
Lowest Beta Portfolio Composition (Optimised Weight)
- Bitcoin (BTC) – 20%
- Ethereum (ETH) – 10%
- Ripple (XRP) – 15%
- Dash (DASH) – 15%
- Ethereum Classic (ETC) – 15%
- ChainLink (LINK) – 25%
Highest Beta Portfolio Composition (Optimised Weight)
- Bitcoin (BTC) – 20%
- Tron (TRX) – 5%
- EOS (EOS) – 15%
- IOTA (MIOTA) – 25%
- Cardano (ADA) – 10%
- Binance Coin (BNB) – 25%
Middle Beta Portfolio Composition (Optimised Weight)
- Bitcoin (BTC) – 20%
- Bitcoin Cash (BCH) – 30%
- Litecoin (LTC) – 20%
- Stellar (XLM)- 5%
- Monero (XMR)- 20%
- NEO (NEO) – 5%
The optimised weights for the “Lowest Beta” portfolio were too compelling not to share.
We found that the “Lowest Beta” portfolio outperformed the price performance of Bitcoin on EVERY single period since 1st October 2017 right through to 1st January 2020, regardless of which month the investment was made.
The outcome is significantly consistent and the evidence is clearly illustrated in Table 5, below, where we may see the returns of the “Lowest Beta” portfolio rising more than the price of Bitcoin during uptrends and falling less than the solo price of Bitcoin during downtrends. This is consistent on each and every period!
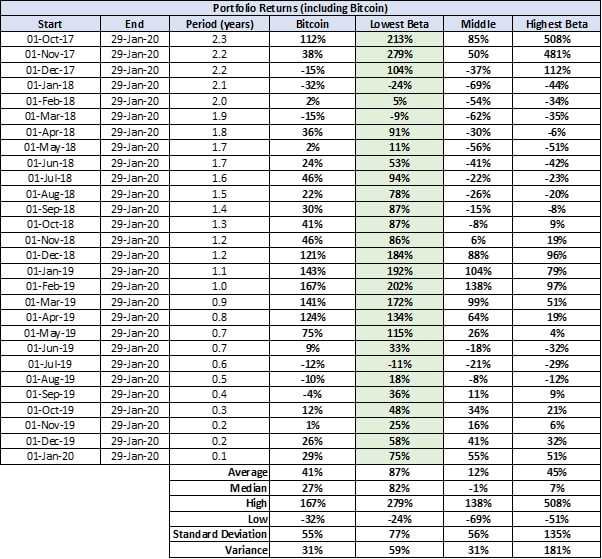
The chart (below) illustrates the periodic returns shown above in Table 5 in graphical format for ease of analysis.
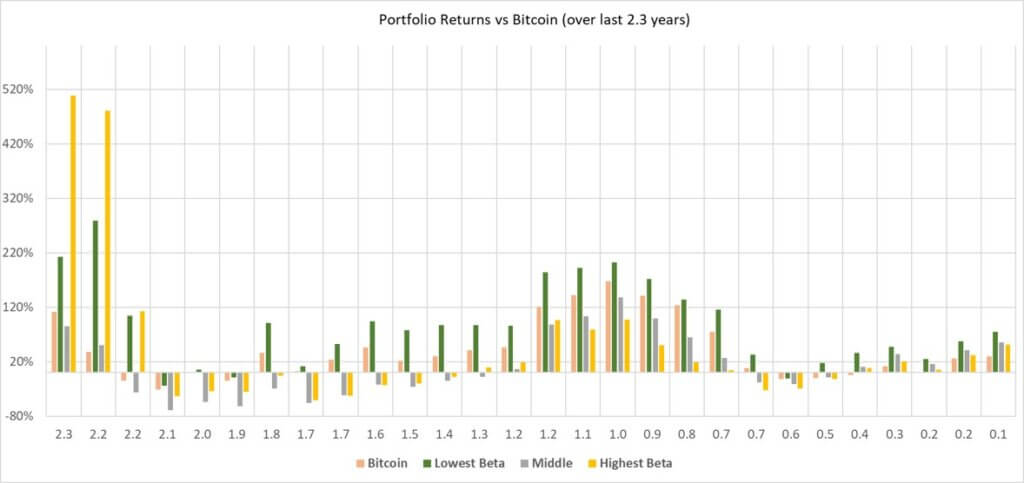
We believe the results of our analysis are extremely compelling and we will continue to monitor and track the optimised “Low Beta” portfolio vs Bitcoin on a monthly basis.
If you thought this was educational then please feel free to share our report and make reference to it. In the meantime, we remind our audience that the content on CoinMarketExpert.com should not be construed as investment advice. Always do your own research.