Updated: 22nd November 2019
We derived our own Bitcoin log price chart from first principle and thoroughly investigated the trend to derive interesting insights in an attempt to make sense of the current price trajectory of Bitcoin.
Buy Bitcoin: recommended exchanges and platforms
| Key Points: | Buy Bitcoin: | |
|---|---|---|
 | ⭐ One of the best crypto exchanges in the market right now! ⭐ High on security and safety (SAFU, 2FA, etc..). ⭐ Largest selection of cryptos to trade. ⭐ Ability to buy crypto with fiat. | |
| | ⭐ leading social trading platform, trusted by millions of users from more than 140 countries. ⭐ Wide variety of trading options (crypto, stocks, ETFs, forex, commodities, etc...) ⭐ Copy the trades of top performing traders and portfolios! ⭐ 0% commissions on all stocks! | |
| | ⭐ Legitimate crypto exchange and trading platform. ⭐ Low trading and exchange fees. ⭐ Free practice demo account with 50,000 USDT. ⭐ Make your first deposit and receive a 25 USDT Welcome Bonus. | |
| Disclaimer eToro is a multi-asset platform that offers both investing in stocks and crypto assets, as well as trading CFDs. CFDs are complex instruments and come with a high risk of losing money rapidly due to leverage. 67% of retail investor accounts lose money when trading CFDs with this provider. You should consider whether you understand how CFDs work and whether you can afford to take the high risk of losing your money. Past performance is not an indication of future results. Cryptoassets are volatile instruments that can fluctuate widely and therefore are not appropriate for all investors. Other than via CFDs, trading crypto assets is unregulated and therefore is not supervised by any EU regulatory framework. eToro USA LLC does not offer CFDs. eToro USA LLC makes no representation and assumes no liability as to the accuracy or completeness of the content of this publication. This publication has been prepared by our partner utilizing publicly available non-entity specific information about eToro. | ||
Disclaimer: All of the content written on CoinMarketExpert is unbiased and based on objective analysis. The information provided on this page should not be construed as an endorsement of cryptocurrency, a service provider or offering and should neither be considered a solicitation to buy or trade cryptocurrency. Cryptocurrencies carry substantial risk and are not suitable for everyone. No representation or warranty is given as to the accuracy or completeness of this information and consequently, any person acting on it does so entirely at their own risk. See further disclaimer at the bottom of the page.
Looking for More Ways to Use Your Crypto?
If you’re intrigued by the possibilities that cryptocurrency offers beyond traditional investing, consider exploring crypto casinos. On our crypto casino page, you’ll find valuable insights, comparisons, and strategies for using your crypto in the online gaming world. From top casinos with attractive welcome bonuses to platforms that accept fiat payments, we cover everything you need to know to make smarter, safer choices when playing at crypto casinos. Whether you’re curious or experienced, there’s something for everyone!
In this research post we attempt to answer the following questions:
1. Is Bitcoin really in a bear market?
2. Where could the potential floor price for Bitcoin reside?
3. Where could the price of Bitcoin rise to after the next halving in May 2020?
We use natural log price charts because they visually capture the long-term price trend of Bitcoin.
The nominal price of Bitcoin has risen stratospherically over time, which makes it is impossible to obtain any meaningful insights of its long-term price trend using a conventional linear price chart.
Our natural log price chart of Bitcoin consists of the following:
1. 100 and 200 day simple moving averages of the natural log prices;
2. mid points, and;
3. halving dates
Our analysis unveils some interesting observations, so keep reading.
Moving average crossovers mathematically establish the end of a bear markets and the beginning of bull markets
We wanted to derive a mathematical approach to this analysis so that we limit subjectivity as much as possible.
We therefore constructed 100 and 200 day moving averages of the natural log price to help establish objective trigger points.
For example, if we look at the pre-November 2012 halving period, as per chart below, we may see the natural log price of Bitcoin rising to a resistance level (red arrow #1) followed by a decline to support level (green arrow #1).
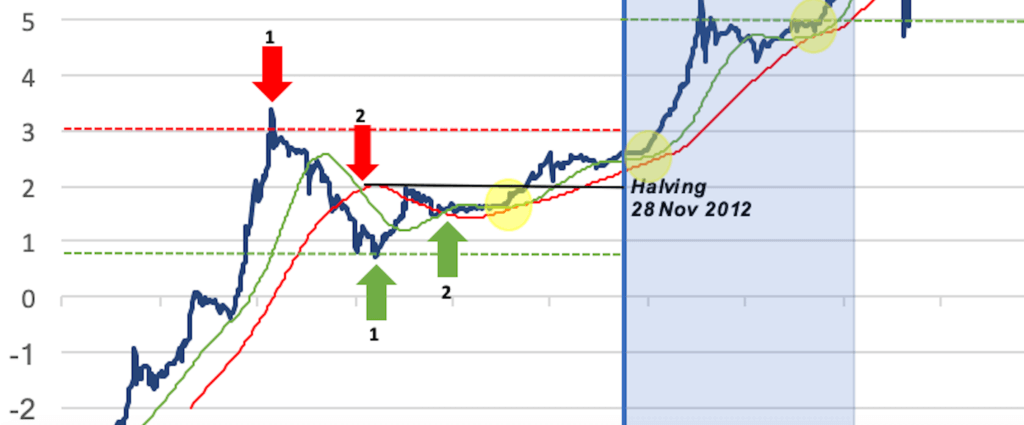
As the log price moves from (red arrow #1) to (green arrow #1), the 100-day moving average crosses through the 200-day moving average from above (red arrow #2), acting as a trigger point to confirm a bear market mega cycle.
The concept of a mega cycle is important because it marks the beginning of a trend that eventually sees the price of Bitcoin rise to a new record high (bull market mega cycle) followed by the immediate sell off (bear market mega cycle).
When the natural log price of Bitcoin bounces off the support level (green dotted line) and rises to the mid point line (dark bold line), we can see the 100-day moving average beginning to cross through the 200-day moving average from beneath, confirming the start of a bull market mega cycle, with the post-halving period acting as a catalyst for propelling Bitcoin to a new record-high price and establishing the ceiling of a new channel until the next halving occurs.
And this process keeps going on and on…
We found the moving average crossovers for bear market mega cycles as being somewhat lagging, since the signal is provided somewhere towards the middle or the end of the cycle. In contrast, the moving average crossovers for bull market mega cycles fare much better at validating the beginning of a new mega cycle.
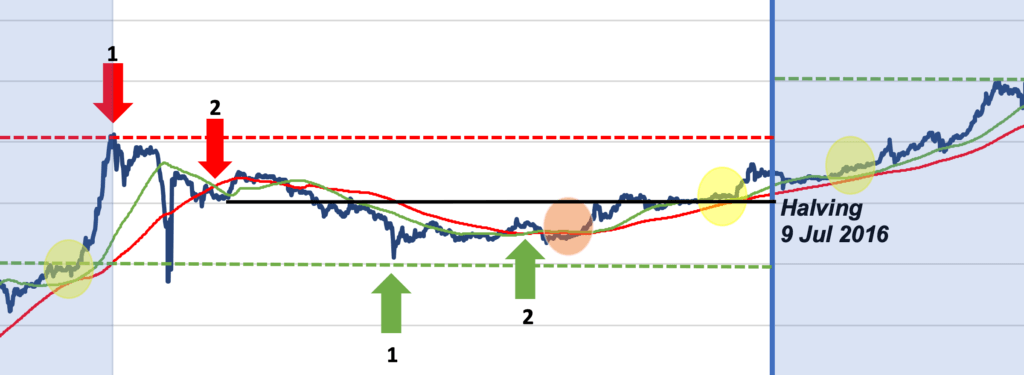
If we look at the period running up to the 9 July 2016 halving, we may see an almost identical pattern forming, with the exception that there is an additional crossovers at the midpoint (dark bold line).
Any crossovers that occur immediately after the first crossover signal are not given any weighting. Therefore, what matters is the first bullish or bearish moving average crossover within a period.
And in so doing, we have been able to mathematically establish a series of channel tops (red line) and channel bottoms (green line) together with mid points.
At the mid point, we observe the log price of Bitcoin exhibiting some sort of mean reversion tendency ( by around 1 standard deviation on either side) in the run up to the next halving.
But these patterns we have been describing are consistently visible in the log price charts, see below.
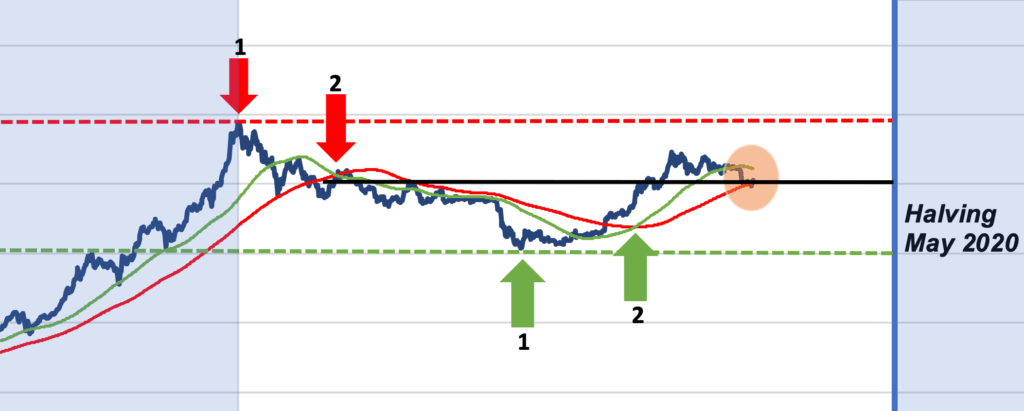
And by applying the same logic, the same pattern is formed in the run up to the May 2020 halving, as may be seen below.
So now we have established a reliable mathematical model for dividing up these log price trends, what else can we identify?
Bullish moving average crossovers form 9-12 months before the halving of Bitcoin
As we may see from the charts above, bullish crossovers (when the 100 day moving average crosses through the 200 day moving average from below) start to become visible around 9-12 months before a halving.
1. The first bullish crossover appeared 9 months before Bitcoin’s halving on 28th November 2012;
2. The second bullish crossover appeared 12 months before the halving on 6th July 2016;
3. And the third bullish crossover has already appeared in May 2019, exactly 12 months before the May 2020 halving!
These observations correlate with our findings in a separate research post, which you may read here.
Bitcoin may currently be in a bull market megacycle
Interestingly, the moving average cross overs that formed in May 2019 confirm that Bitcoin is currently already in a bull market mega cycle.
Most people looking at a linear chart may easily assume the price of Bitcoin has been in a bear market since Q2 of this year.
This observation would not be entirely inaccurate if you were looking at a traditional financial asset or index, where a bear market is defined by a 15% – 20% decline.
But in the case of Bitcoin, it is possible to have a traditional “mini” bull and bear market cycles within a mega cycle.
This is the reason why we are using log prices after all and why we should differentiate between normal cycles vs mega cycles when it comes to Bitcoin.
We hope this concept is clear because according to the log price chart of Bitcoin, the current bearish trend may best described as a bullish consolidation before the next stratospheric leg up is made.
Of course we are assuming that historical patterns will continue to play out. But given the uncanny near-identical resemblance of these patterns it is hard to believe it will not play out in a similar way this time around as well.
The majority of outperformance tends to happen after the halving of Bitcoin
Unlike Litecoin, Bitcoin’s price really starts to go into overdrive after the halving, as may be seen in the blue-shaded areas of the charts above.
Nonetheless, long-term investors (HODLERS) would probably maximise their ROI by accumulating long exposures to Bitcoin before the halving period.
The conditions to support a stratospheric rise in the price of Bitcoin are ripe
1. Global macro conditions are breaking down;
2. Geopolitical tensions and protectionism are on the rise;
3. Monetary policy instruments are broken, with central banks currently resuming Quantitative Easing (QE). There have also been discussions regarding the benefit of deep negative interest rate policies.
4. And as we move into deep negative interest rates, the traditional banking system will come under increasing strain. We suspect certain banks may have to close down or become nationalised and even consider merging to survive.
And let’s face it, over a decade has past since the previous financial crisis, and yet banks have not been able to wean themselves entirely off interest income. Bank business models are still stuck in the old ways of doing things.
5. The risk of a policy mistake and another banking crisis is high and rising.
So what does this mean for Bitcoin?
Bitcoin is in a win-win scenario.
Best case scenario: If low interest rates stimulate risk appetite and add fuel to the stock market rally, an increase in wealth will benefit Bitcoin, perhaps even more so than in the past since there are entities such as Bakkt sprouting up to provide institutional investors with a regulated conduit for obtaining an exposure to physical Bitcoin.
Worst case scenario: a loss of trust in the traditional financial system stands to see money flowing into anything that may resemble a safe haven.
And if investors allocate even a small 2%-5% position to their portfolios to Bitcoin, the effect would be extremely bullish on the price.
So, we have established that as extremities become increasingly likely, Bitcoin stands to benefit in some way or the other.
Perhaps the worst thing that can happen to Bitcoin is sideways trading (or a trend less) stock market.
Bitcoin price prediction based on the historical log price trajectory
There are insufficient data points to be able to make a precise estimate and since we are using log prices to predict the future price of Bitcoin there is a risk of material distortion.
Therefore the observations we make should not in any way be construed as investment advice or a solicitation to trade Bitcoin.
Assuming the historical log price patterns continue to hold, it is possible for the price of Bitcoin to rise to a new channel that would see the price gyrate between $22,000 and $162,754!
These are mathematical derivations based on the price of Bitcoin following a similar historical log price trajectory.
Let’s explain further.
The log price chart at the very top of this page is divided into various channels, showing pre and post halving periods. These channels are characterised by resistance levels (red dotted lines) and support levels (green dotted lines).
If we look a the log price charts, we can see the second channel was established four natural log prices above the first channel. And then rising three natural log prices to establish the third channel that we currently are in.
We note the gradient for establishing the new channels has been diminishing over time. Therefore our price prediction is based on the natural log price rising by two to Ln10 and Ln12, and this occurring after the May 2020 halving.
If that does in fact materialise, that would imply a Bitcoin price range of $22,000 to $162,754.
Based on a Bitcoin circulation supply of 18 Million, that would equate to market capitalisation range of $396 Billion – $2.9 Trillion.
The latter actually surpasses the market capitalisation of any single publicly listed company!
And with a $3 Trillion market cap, Bitcoin’s aggregate value would compare to that of a developed country, such the United Kingdom.
A $3 Trillion Bitcoin market cap may appear unrealistic although its only 33% of the total gold market cap (based on a gold spot price of $1,500 per troy ounce). If you’re interested in understanding the relationship between gold and Bitcoin, click here.
So why is the price of Bitcoin not higher right now?
Possible collusion or manipulation by miners?
We hypothesis there is actually an incentive for those miners that have heavily invested in newer (and faster) mining equipment to intentionally exert pressure on the price of Bitcoin.
And by doing so, a lower price would help to wipe out the slower competing miners that are contributing to the rising difficulty rate of mining new blocks.
This survival of the fittest scenario would help the fastest miners maximise the number of Bitcoins they can acquire before the next halving in May 2020.
Historically, it is not unusual for Bitcoin to go through mini bull and bear periods whilst in a mega cycle
If we go back to the charts we can see that bull market mega cycles start to form around 12-18 months (green arrow #1 on the charts) before the halving date of Bitcoin.
The 12-18 month time range has been consistent.
As a matter of fact, the chart shows that the recent bull market mega cycle (green arrow #1) beginning to form in December 2018, which is 17 months away from the May 2020 halving date.
This means the current phase remains consistent with the historical range.
But the charts also show the natural log price of Bitcoin overshooting and undershooting the mid point during the period between red arrow #2 and the halving dates. When this undershooting or overshooting occurs the price of Bitcoin goes through mini bull and bear periods.
And currently, we are going through an undershooting period, whereby the log price of Bitcoin has fallen below the mid point line after initially overshoot that level following the bullish cross over (green arrow #2) in May 2019.
As stated earlier in this report there appears to be some mean reversion tendency around the mid point.
Historically, after bullish cross overs (green arrow #2), we observe multiple periods when the natural log price of Bitcoin occasionally gravitates very close to the 200-day moving average (yellow circles).
And on one instance before the 6th July 2016 halving, the natural log price of Bitcoin had breached the 200-day log price moving average (orange circle). That was only a temporary condition and the natural log price eventually resumed an uptrend.
Currently, we may see that Bitcoin is in a period that is remarkably similar to the 6th July 2016 pre halving period.
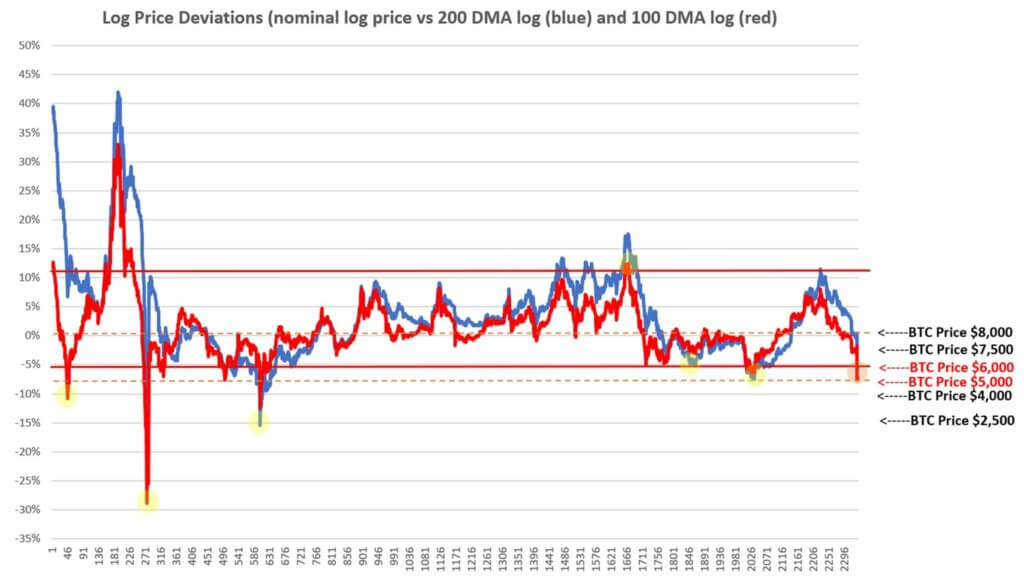
If we assume the natural log price will breach the 200-day moving average by a small margin, as it did during the 6th July 2016 pre halving period, then the lowest price Bitcoin may fall to over this period without beginning to deviate away from historical log price pattern is $7,500. [updated 22 November 2019: in a post updated on 24th October, we had revisited this log price analysis and conducted a more precise mathematical assessment, which may also be found below. We identified that the price of Bitcoin could fall as much as $5,000 based on historical price overshootings of the current magnitude repeating themselves].
In our 24th October post, we had noted the following:
This bear market is not likely to last as long as the previous
The conditions are very different this time around. We believe there is a good chance Bitcoin may recover much sooner than previous bear markets due to the hype around the Bitcoin halving in May 2020.
Those of you who are interested in reading more about Bitcoin’s historical price performance during the previous two halving events may do so here.
We do not have a crystal ball so we do not know whether this hypothesis will even pan out. However, if we had to make an educated guess, we would be looking for a Bitcoin recovery (or bottom) to start to occur sometime between December and January, which coincides with the seasonal santa rally that is typically seen across developed stock markets.
Historically, risk appetite tends to pick up between December and January as bonuses become known and portfolio rebalancing for the following year starts to take place.
And based on our previous research, it is possible for Bitcoin to be supported somewhere between $5,000 – $6,000, as may be seen from the chart below.
Of course, the analysis in this report is based on historical patterns repeating themselves.
Whilst it gives us confidence to see consistency between current and historical patterns, readers should note that past performance is not indicative of future performance.
Where to buy Bitcoin?
| Key Points: | Buy Bitcoin: | |
|---|---|---|
| | ⭐ One of the best crypto exchanges in the market right now! ⭐ High on security and safety (SAFU, 2FA, etc..). ⭐ Largest selection of cryptos to trade. ⭐ Ability to buy crypto with fiat. | |
| | ⭐ leading social trading platform, trusted by millions of users from more than 140 countries. ⭐ Wide variety of trading options (crypto, stocks, ETFs, forex, commodities, etc...) ⭐ Copy the trades of top performing traders and portfolios! ⭐ 0% commissions on all stocks! | |
| | ⭐ Legitimate crypto exchange and trading platform. ⭐ Low trading and exchange fees. ⭐ Free practice demo account with 50,000 USDT. ⭐ Make your first deposit and receive a 25 USDT Welcome Bonus. | |
| Disclaimer eToro is a multi-asset platform that offers both investing in stocks and crypto assets, as well as trading CFDs. CFDs are complex instruments and come with a high risk of losing money rapidly due to leverage. 67% of retail investor accounts lose money when trading CFDs with this provider. You should consider whether you understand how CFDs work and whether you can afford to take the high risk of losing your money. Past performance is not an indication of future results. Cryptoassets are volatile instruments that can fluctuate widely and therefore are not appropriate for all investors. Other than via CFDs, trading crypto assets is unregulated and therefore is not supervised by any EU regulatory framework. eToro USA LLC does not offer CFDs. eToro USA LLC makes no representation and assumes no liability as to the accuracy or completeness of the content of this publication. This publication has been prepared by our partner utilizing publicly available non-entity specific information about eToro. | ||
On the other hand, if you are a traditional buy and hold crypto investor (a “hodler” in other words), you may want to consider Celsius Network, which allows you to buy Bitcoin and store it safely in return for an attractive APR of 4.51%-6.20%.
What we really like about Celsius Network is, nonetheless, the high-yielding stablecoin savings accounts, which have APRs of up to 13.86%!
If you enjoy reading our updates and analysis then start following us on Twitter