This page identifies interesting bitcoin price trends and insights that crypto traders and investors may find helpful when used in conjunction with their own analysis.
We aim to update this page periodically with new insights so be sure to check in once in a while!
Disclaimer: All of the content written on CoinMarketExpert is unbiased and based on objective analysis. The information provided on this page should not be construed as an endorsement of cryptocurrency, a service provider or offering and should neither be considered a solicitation to buy or trade cryptocurrency. Cryptocurrencies carry substantial risk and are not suitable for everyone. No representation or warranty is given as to the accuracy or completeness of this information and consequently, any person acting on it does so entirely at their own risk.
Previous bitcoin research that may be of interest:
- Is the Hash Rate a good predictor of Bitcoin’s Price?
- Making sense of the Bitcoin hash rate: a valuable fundamental indicator for investors
- Bitcoin Log Price Chart Analysis: A thorough investigation
- Bitcoin Price Analysis: Pre & Post Halving Event Performance
- Bitcoin Strategy: How stablecoin savings can be used to offset potential BTC losses
- How we developed a cryptocurrency portfolio that beats Bitcoin
July 2021
This week we look at bitcoin golden crosses and death crosses to understand whether they are reliable indicators for crypto traders and investors.
Bitcoin Golden Cross Price Analysis
Since 2015, bitcoin (BTC) has seen 5 golden crosses, calculated by taking the 50-day and 200-day simple moving averages (‘SMA’) of the price.
![]()
![]() A golden cross occurs when the short-term moving average crosses through a long-term moving average to the upside. This particular type of crossover is widely interpreted by analysts and traders as signaling the beginning of an upward bullish price trajectory. But does this hold true for bitcoin as well?
A golden cross occurs when the short-term moving average crosses through a long-term moving average to the upside. This particular type of crossover is widely interpreted by analysts and traders as signaling the beginning of an upward bullish price trajectory. But does this hold true for bitcoin as well?
| Bitcoin Gold Cross Dates | 50 SMA> 200 SMA (days) | Max Gain (%) | Time to Max Gain (days) | Max Loss (%) | Time to Max Loss (days) |
|---|---|---|---|---|---|
| 14-Jul-15 | 61 | +2.4% | 14 | -26.6% | 41 |
| 28-Oct-15 | 883 | +6,300.6% | 780 | +2.1% | 14 |
| 24-Apr-19 | 184 | +138.2% | 63 | +2.4% | 1 |
| 19-Feb-20 | 34 | +3.0% | 4 | -48.4% | 22 |
| 22-May-20 | 393 | +599.2% | 327 | -3.2% | 3 |
⚠️ It is wrong to assume that a golden cross is always followed by a bullish price predisposition. Sharp sell-offs have occasionally followed a bitcoin golden cross historically. However, it is interesting to point out that bitcoin golden crosses that were formed in the vicinity of previous halving dates saw material outsized returns follow.
Bitcoin Golden Cross: 14th July 2015
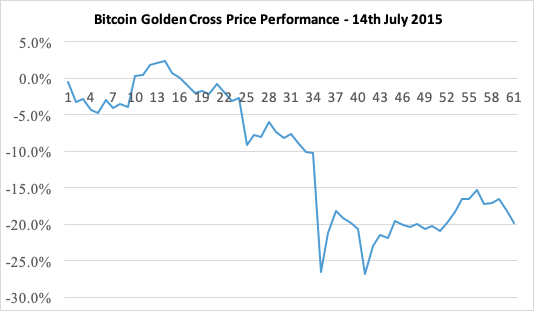
On 14th July 2015, a golden cross was confirmed although instead of experiencing a bullish continuation, BTC/USDT lost 26.6% of its value 41 days later.
Bitcoin Golden Cross: 28th October 2015
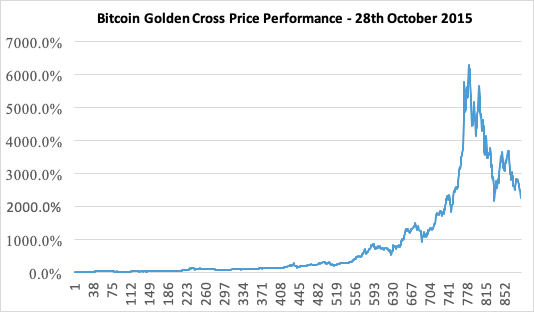
The best golden-cross price-performance for bitcoin was seen from the period beginning 28th October 2015 (255 days before the 9th July 2016 halving date). This bullish megacycle peaked a little over 2 years (780 days) from the golden cross date.
Bitcoin Golden Cross: 24th April 2019
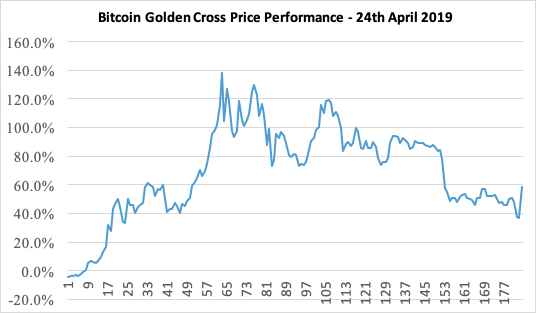
On 24th April 2019, another bitcoin golden cross was formed which resulted in a bullish continuation, peaking 63 days later following a 138.2% rally.
Bitcoin Golden Cross: 19th February 2020
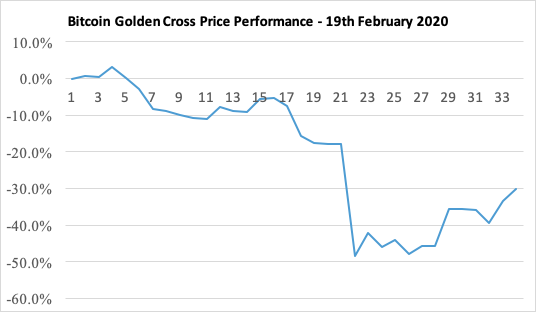
On 19th February 2020, bitcoin formed a golden cross. The price of BTCUSDT rose by 3% three days following the golden cross date before reversing with a 48.4% dip.
Bitcoin Golden Cross: 22nd May 2020
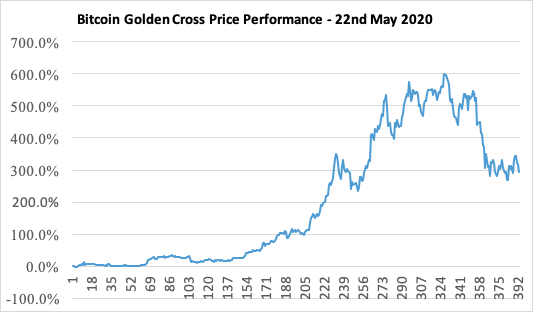
Another bitcoin golden cross was formed on 22nd May 2020, 11 days after the 11th May 2020 bitcoin halving date. This was followed by a bullish continuation that saw a near 600% gain since 22nd May 2020.
Based on a limited number of observations, it appears the best bitcoin golden-cross price-performance has coincided around halving dates.
Otherwise, golden crosses should be treated with an element of skepticism and caution since they do not guarantee a bullish price continuation.
Bitcoin Death Cross Price Analysis
Since 2015, bitcoin (BTC) has seen 5 death crosses, calculated by taking the 50-day and 200-day simple moving averages (‘SMA’) of the price.
![]()
![]() A death cross occurs when the short-term moving average crosses through a long-term moving average to the downside. This particular type of crossover is widely interpreted by analysts and traders as signaling the beginning of a downward bearish price trajectory.
A death cross occurs when the short-term moving average crosses through a long-term moving average to the downside. This particular type of crossover is widely interpreted by analysts and traders as signaling the beginning of a downward bearish price trajectory.
| Bitcoin Death Cross Dates | 50 SMA< 200 SMA (days) | Max Gain (%) | Time to Max Gain (days) | Max Loss (%) | Time to Max Loss (days) |
|---|---|---|---|---|---|
| 14-Sep-15 | 43 | -0.1% | 2 | -2.0% | 25 |
| 30-Mar-18 | 389 | +43.1% | 36 | -53.0% | 260 |
| 26-Oct-19 | 115 | +11.7% | 109 | -28.2% | 52 |
| 25-Mar-20 | 56 | +49.0% | 43 | -11.4% | 4 |
| 19-Jun-21 | 6 | +3.7% | 4 | -11.3% | 2 |
⚠️ It is wrong to assume that a bitcoin death cross is followed by a bearish continuation (further sharp declines). Bitcoin death crosses may be followed by mediocre price gains and sometimes material price gains! Therefore, a bitcoin death cross does not always signal the beginning of a crypto winter.
Bitcoin Death Cross: 14th September 2015
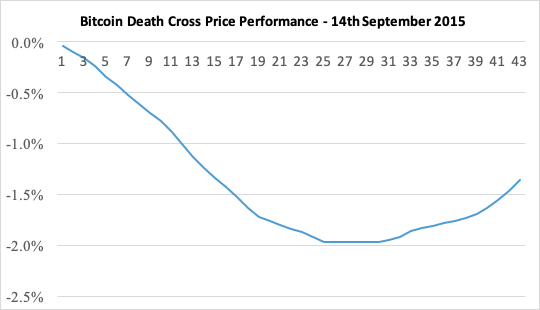
On 14th September 2015, a bitcoin death cross had occurred. The death cross period lasted 43 days in total and we can see that the maximum loss from the period a death cross was confirmed was -2%.
Bitcoin Death Cross: 30th March 2018
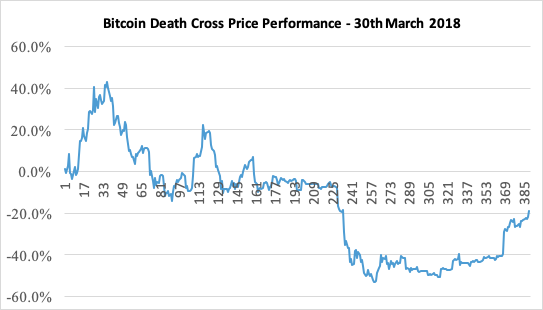
On 30th March 2018, a bitcoin death cross had been confirmed. The death cross period had lasted over 1 year (389 days in total) with a max loss of 53% seen from the date a death cross had been confirmed.
However, note that at the very beginning of the period bitcoin had rallied 40% before retreating so anyone entering a short BTC/USDT position on the death cross date would have had to fund their short position to avoid being liquidated.
Bitcoin Death Cross: 26th October 2019
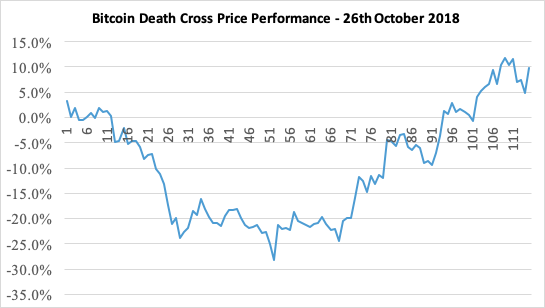
On 26th October a bitcoin death cross had been confirmed although BTC/USDT rose by circa 5% immediately after before falling 28.2% from the point a death cross had been confirmed. That was followed by a rally that saw bitcoin eventually rise 11.7% above the death-cross date.
Bitcoin Death Cross: 25th March 2020
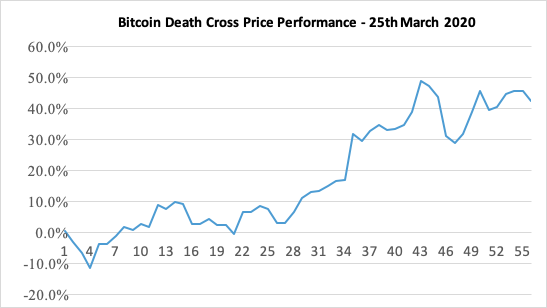
On 25th March 2020, a bitcoin death cross had been validated, which saw BTC immediately decline 11.4% within 4 days. BTCUSDT eventually rose 49% from the death cross date, as the chart above illustrates.
If you have any insights that you would like to share then reach out to let us know.