Flash Alert: Monday 11th November
The big move we were anticipating is finally materialising!
Following our update on Thursday, we saw the price of BTCUSDT initially fall to the 180-day EMA on Friday, where it found some support. Then on Saturday and Sunday there was further support at the 25-day simple moving average before faltering again today.
The latest move confirms to us that the bias over the short term remains to the downside.
At the time of writing today, the price of BTCUSDT was trading at $8,736, up from an earlier intra-day low of $8,618 although below an earlier high of $9,072. Overall, the price of Bitcoin is down by approximately $580 from the levels seen in our previous update on Thursday.
But we note the observations made in last week’s update continue to pan out and remain very relevant.
Base-case scenario for the bulls
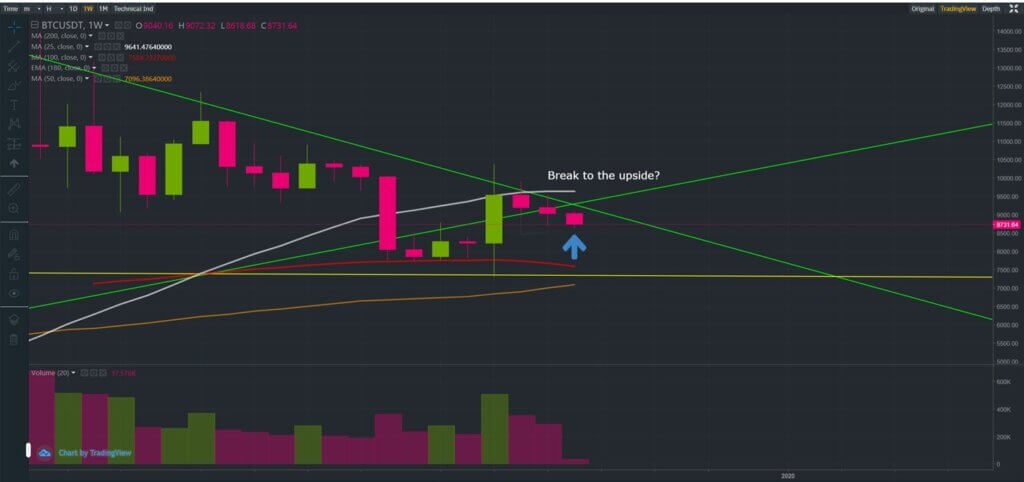
To briefly recap last week’s update, we had mentioned that a close below the 200-day simple moving average and the $9,000-$8,900 levels would see Bitcoin fall further to test the 50-day simple moving average, currently $8,542, and quite possibly the $8,200 level.
In our base case scenario, we believe there is a good chance of seeing Bitcoin attract fresh buyers between $8,542 and $8,200, which could reinvigorate the price enough to propel it through the 100-day moving average of $9,500 – $9,600; breaching those levels is required to keep the recent bullish trajectory alive.
But for our base case scenario to pan out, Bitcoin would need to break through $9,500-$9,600 sometime this week, as the weekly chart below also alludes to.
Worse-case scenario for the bulls
In our previous update, which remains very relevant, we had also stated that a drop below $8,200 would put the bears firmly back into the game and the $7,000 level would likely be retested. The monthly chart below illustrates that rationale as well.
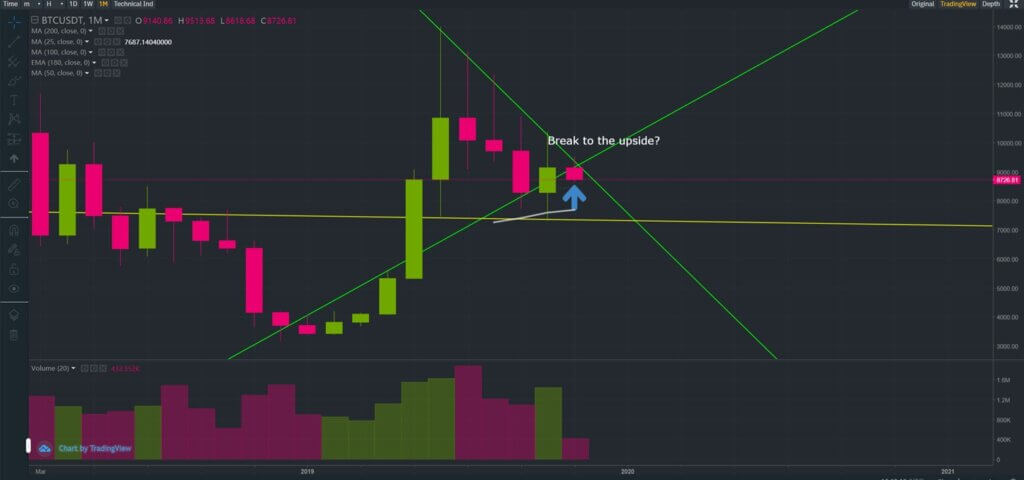
If Bitcoin is unable to breakout this week, the price is likely to drift further south towards the $7,000 level.
If support at the $7,000 level holds up, the bulls may have another chance to see a breakout between December-January (as a matter of fact we made that observation in an earlier report, which you may read here). As a brief recap, we had mentioned that a bear market is not likely to last as long as previous bear markets since the conditions are very different this time around with the May 2020 halving (or halvening) just around the corner.
We stated that if we had to make an educated guess, we would be looking for a Bitcoin recovery (or bottom) to start to occur sometime between December and January, which coincides with the seasonal santa rally that is typically seen across developed stock markets.
Worst-case scenario for the bulls
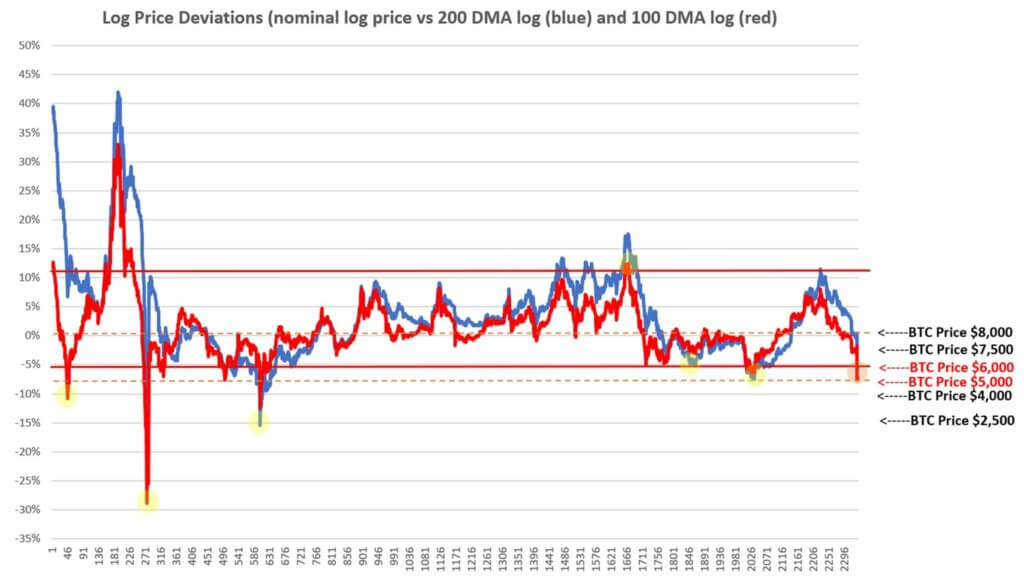
We had previously attempted to calculate a bottom for Bitcoin utilising historical log prices and hypothesised that in the worst case scenario Bitcoin may bottom somewhere between $5,000 – $6,000.
That observation was made in the same report, which you may read here. And the chart below is a continuation of our log price analysis that sets the foundation for calculating a possible bottom for Bitcoin based on historical log price movements and conditions that resemble the current period.
Our stance on Bitcoin
Although we do not discount the possibility of seeing further short-term price weakness, we continue to maintain a bullish stance on Bitcoin.
We know past performance is never indicative of future performance although it is also very interesting to point out that the price of Bitcoin over the past year (orange line) has behaved almost identical to the pre-halving period seen in 2012 (dark grey line), as may be seen in the chart below.
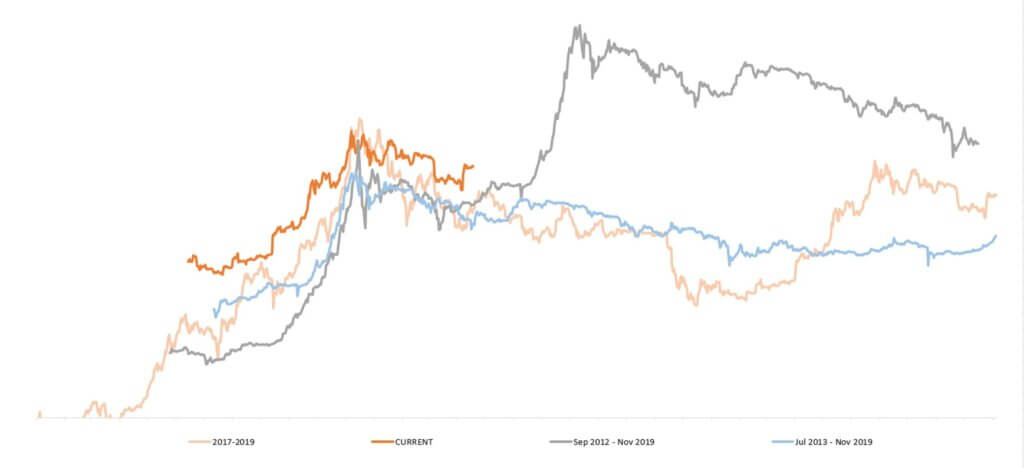
With the Bitcoin halving date (or “halvening” as some of you prefer to call it) now just 6 months away, we envisage a bottom to be imminent.
We do not see any point in becoming bearish on Bitcoin at this juncture because our base-case scenario is only $536 away from the current price.
Whilst there may be some merit in turning bearish based on our worst-case scenario, which is $3,736 away from the current price, we point out that the upside potential could dwarf the downside opportunity. For this reason we prefer to maintain our bullish stance on Bitcoin even if our worst case scenario does indeed pan out.
But of course we do not have a crystal ball. We attempt to apply a combination of mathematics, fundamental and technical analysis to our updates to provide you with fresh and unique insights although at the end of the day there are no guarantees. Our expected scenarios may be completely wrong and therefore we warn our growing audience to tread very carefully and their own risk. Bitcoin is very risky (as you must all know by now) and reiterate that past performance is never indicative of future performance.
If you enjoy reading our updates and analysis then start following us on Twitter.
A follow up to this next Flash Alert may be found here.
Anyone interested in reading our previous updates may do so here as they remain valid and provide a good trail for anyone wanting to catch up.
If you’re thinking about trading bitcoin then visit our bitcoin price analysis page. Here we periodically provide interesting bitcoin price insights and analyses that every crypto trader and investor should be aware of.
