Flash Alert: Thursday 24th October
Libra opposition derailed hopes for a strong rebound
Let’s take a step back to recap the week before moving forwards to the present situation.
Earlier this week we saw Bitcoin bounce back up from sub-$8,000 levels to regain ground above the $8,200, which initially raised bullish spirits and hopes for a stronger rebound on Monday.
Many had interpreted previous support between $7,700-$7,800 as a sign Bitcoin is gearing up for a rise towards the top of the bear flag channel (anywhere between $8,500-$8,844).
But Bitcoin was unable to make much progress above the $8,300 threshold on Tuesday as sentiment began to stale a day before Mark Zuckerberg’s testimony to the House Financial Services Committee.
And on Wednesday, we saw Bitcoin knocked below $8,000 again to an intra-day low of $7,300, as regulators and lawmakers grilled Facebook CEO Mark Zuckerberg on his digital currency project Libra and continued to express dissatisfaction with cryptocurrencies in general.
As you may imagine, there were many anti-Bitcoin and crytpocurrency rants, with Congressman Brad Sherman dismissing cryptocurrency completely, arguing it is only useful for facilitating criminal activity. It would not be the first time Congressman Sherman or many other of his peers attack Bitcoin after all. So in the greater scheme of things, these anti-crypto comments emerging from Congress are nothing out of the ordinary.
Since our previous update, the price of Bitcoin is down by approximately $820. And at the time of writing today, the price of BTCUSDT was trading at $7,417 following an earlier intra-day high of $7,497 and low of $7,338.
Bitcoin nears Death Cross
In our previous update on Monday we had pointed out that the 180-day EMA had recently crossed through the 200-day SMA from above. We have found that this type crossover has been accurate at denoting the beginning and the end of bullish cycles in Bitcoin.
And as our bearish conviction over the price trajectory of Bitcoin continues to materialise, we are now seeing the 50-day SMA (yellow) nearing the 200-day SMA (orange) from above, approaching what is known as a death cross. This may be seen from the charts below.
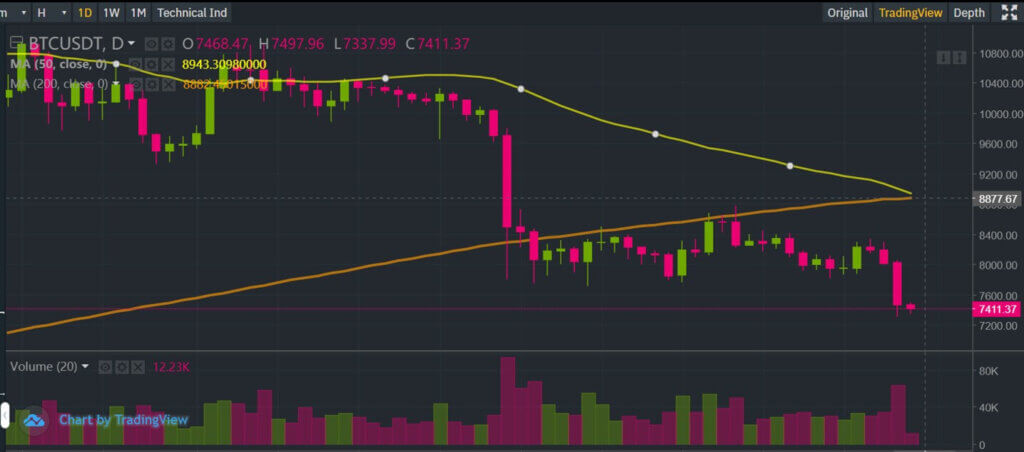
A death cross has traditionally been considered an official confirmation of a bear market. And that is typically followed by steeper price declines.
We have seen other prominent media claim that a death cross usually suggests that Bitcoin is near a bottom although the chart below seems to suggest otherwise.
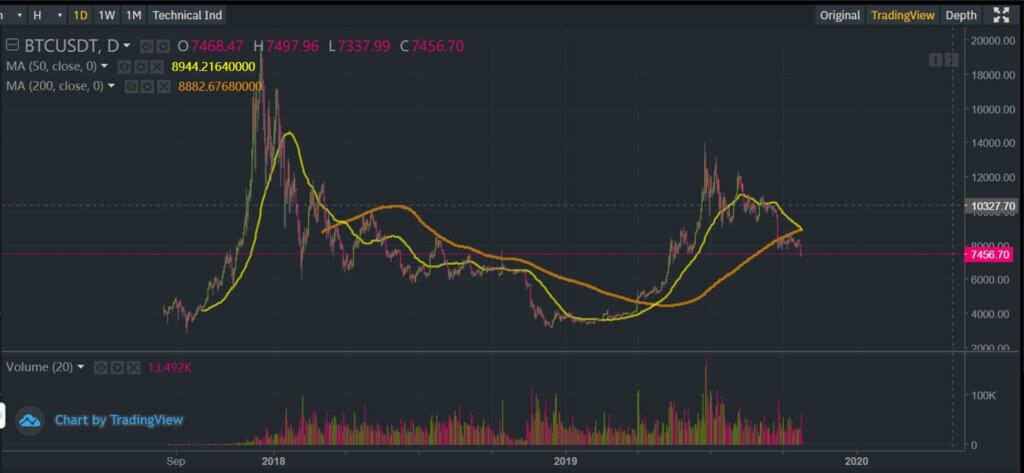
As may be seen from the chart above, at the end of March 2018, the 50-day moving average had crossed through the 200-day moving average from above, forming a death cross.
And it took around 9 months for Bitcoin to find a bottom following the appearance of that death cross, so this is really bearish for Bitcoin.
Certain individuals are going as far as claiming that Bitcoin may fall below $2,000 this time around although we currently believe that is too extreme. That’s our current view at least.
This bear market is not likely to last as long as the previous
This bear market is not likely to be as long as the previous since the conditions are very different.
We believe there is a good chance Bitcoin may recover much sooner than the previous bear market due to the hype around the Bitcoin halving in May 2020.
Those of you who are interested in reading more about Bitcoin’s historical price performance during the previous two halving events may do so here.
We do not have a crystal ball so we do not know whether this hypothesis will even pan out. However, if we had to make an educated guess, we would be looking for a Bitcoin recovery (or bottom) to start to occur sometime between December and January, which coincides with the seasonal santa rally that is typically seen across developed stock markets.
Historically risk appetite tends to pick up between December and January as bonuses become known and portfolio rebalancing for the following year starts to take place.
And based on our previous research, it is possible for Bitcoin to be supported somewhere between $5,000 – $6,000, as may be seen from the chart below.
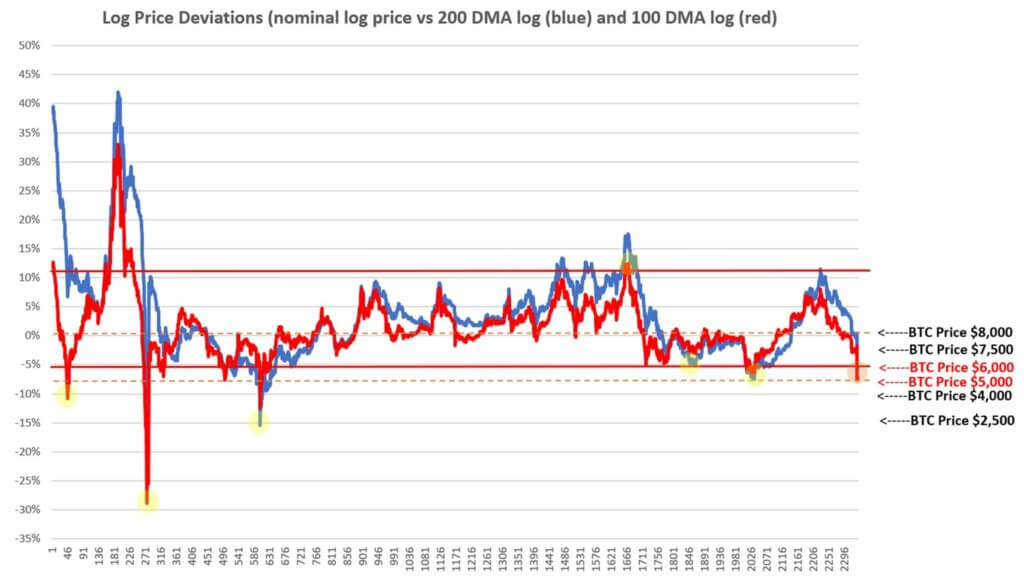
If the substance of our log price analysis research holds up, from which the chart above is derived from, Bitcoin may see a bottom start to form at $6,000 or $5,000 (if the latter fails to hold).
Addendum (24 Oct 19):
Further to the above, we want to add the following point:
Head and Shoulders Formation
There appears to be a head-and-shoulders forming on the daily charts, which adds to our bearish stance. We admit it is not the best looking head-and-shoulders pattern although it still carries merit. We will delve into further detail in the following update.
We reiterate that we do not have a crystal ball and past performance is not indicative of future performance.
If you enjoy reading our updates and analysis then start following us on Twitter.
A follow up to this Flash Alert may be found here.
Anyone interested in reading our previous Flash Alerts may do so here as they remain valid and provide a good trail for anyone wanting to catch up with recent price action.
If you’re thinking about trading bitcoin then visit our bitcoin price analysis page. Here we periodically provide interesting bitcoin price insights and analyses that every crypto trader and investor should be aware of.
