Flash Alert: Thursday 7th November
Selling interest above $9,400 has pierced bullish sentiment
The bullish breakout we were expecting did not materialise yet as selling interest above the $9,400 level capped price gains.
Bitcoin’s reluctance to break into higher grounds (ideally above the $9,500 mark) is naturally causing some trepidation. After all, many market participants (including ourselves) were of the opinion earlier this week that Bitcoin may be gearing up for a major breakout.
In our update on Monday we had mentioned that unless there a big move to the upside very soon, we may see this rebound begin to falter. So in the absence of any major bullish moves, market sentiment is naturally beginning to turn a little sour.
Will the bears prevail?
Nobody has a crystal ball so of course bears have another chance to take the reins.
In our previous update we had identified just a few bearish signs that actually remain valid:
- there is still death cross on the charts, which is bearish;
- the 14-day RSI is not too far away from ‘overbought’ territory;
- the 14-day stochastic RSI has now turned bearish;
- MACD is becoming increasingly less bullish on the daily charts;
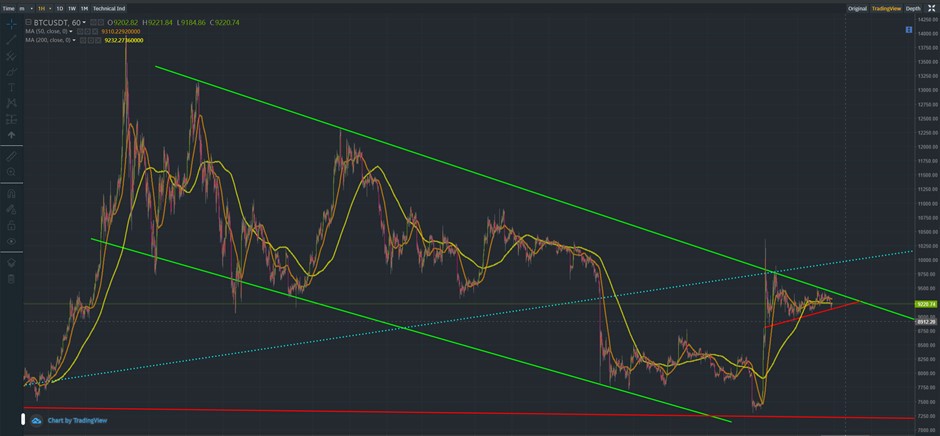
- and we had highlighted that there appears to be symmetrical triangle formation, which over the last couple of months proved to be more bearish (rather than bullish).
Based on the above it is not too far fetched to understand why the market is feeling nervous at the moment.
The 200-day simple moving average remains pivotal
We purposely included a monthly chart because we always look at big picture trends.
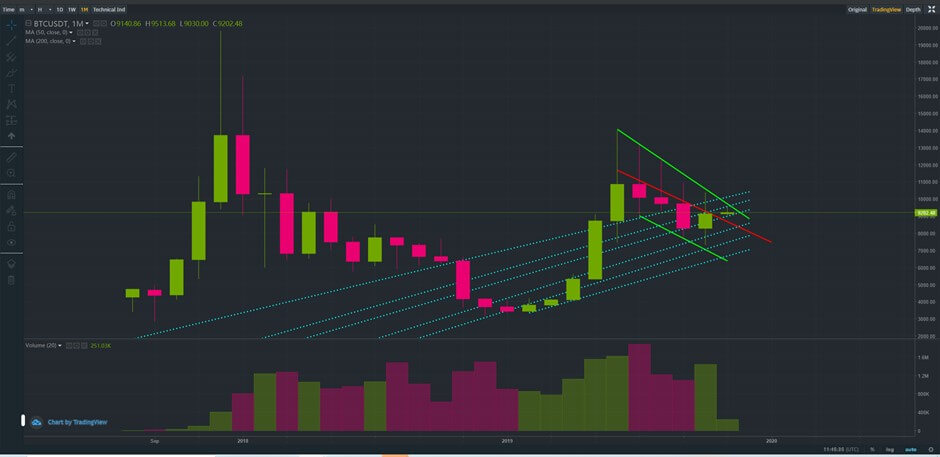
We can see from the monthly chart that Bitcoin has been trading in a wider bearish descending channel, although that trajectory has changed over the last week and a half, implying the bulls are taking the reins.
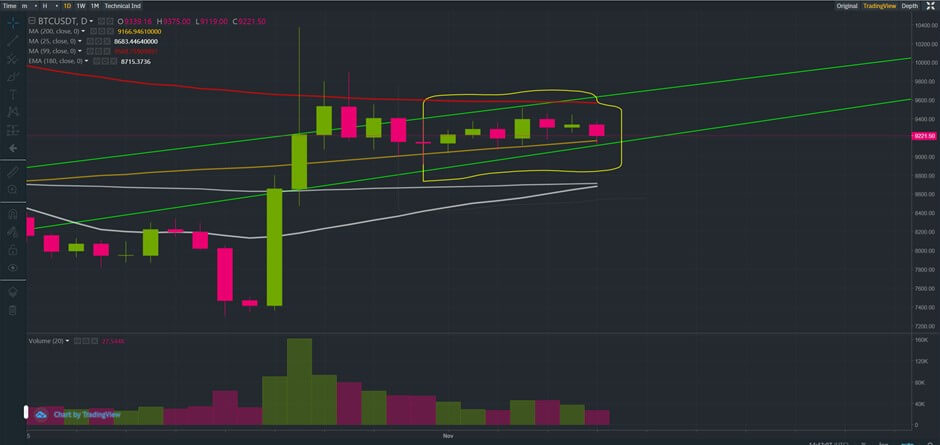
Despite resistance we have seen around the $9,440-$9,450 region, we want to point out that the daily price action seen so far this week has actually been skewed to the upside, with BTCUSDT seen trading in an ascending channel on the daily charts supported by the 200-day simple moving average.
With the $9,200 level violated today, we would not at all be surprised to see the price of Bitcoin test the 200-day simple moving average, currently at $9,167 and possibly the lower 50-day moving average of $8,644.
But we see short-term temporary declines as a requirement for triggering a strong bounce to break through the $9,500-$9,600 levels. A strong move to the upside is needed in order to maintain the upward trajectory Bitcoin has recently embarked upon.
On the other hand, if we are wrong and the 200-day or the 50-day simple moving average falter, the bulls will be at risk of losing the reins again – and fast!
If the price of Bitcoin closes below the 200-day simple moving average we would quickly turn our attention to the $9,000-$8,900 region with a bias towards the 50-day moving average of $8,644 and quite possibly $8,200. A drop to these lower levels would not concern us too much and we would continue to maintain a bullish stance on Bitcoin as long as support is present.
However, a drop below $8,200 would put the bears firmly back into the game and the $7,000 level would very likely be retested.
A big move is brewing for Bitcoin
There is never a dull moment for Bitcoin. And we continue to stand by the title of our Monday update as we believe a big move is brewing.
Which direction exactly? that’s impossible for anyone to foretell precisely. All we can say at this juncture is that we expect a brief period of respite although remain firmly biased to the upside.
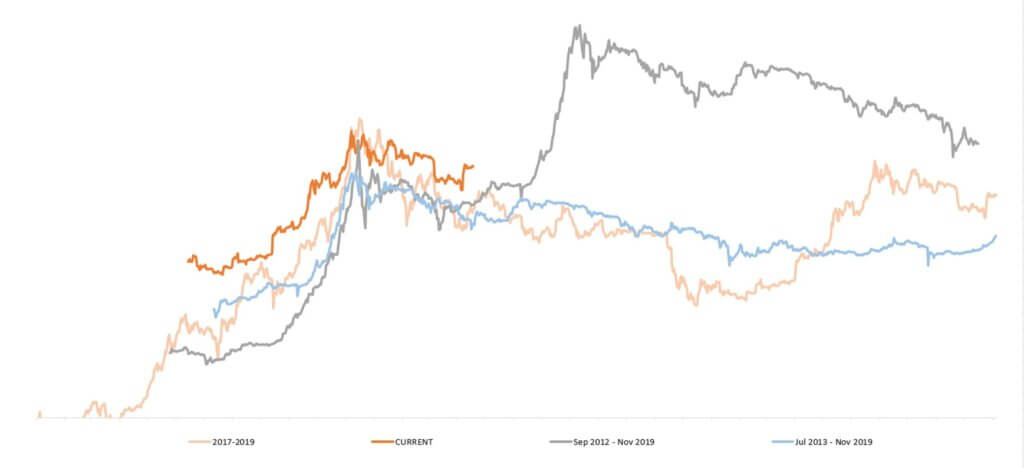
We know past performance is never indicative of future performance although it is very interesting to see the price of Bitcoin over the past year (orange line) behave almost identical to the pre-halving period seen in 2012 (dark grey line), as may be seen in the chart below.
There is also research supporting the view that Bitcoin is fundamentally undervalued so take your time to browse through our research posts thoroughly.
And we can also see the 25-day MA just about to cross through the 180-day EMA from beneath, which is expected to be bullish once it manages to do so.
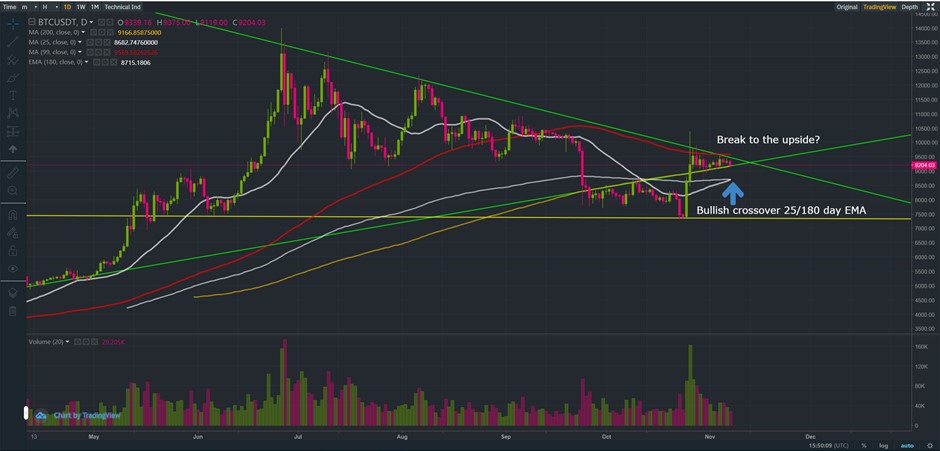
At the time of writing this update today the price of BTCUSDT was trading at $9,204, down from an earlier intra-day high of $9,375 and up from an earlier low of $9,119.
We maintain our bullish stance on Bitcoin despite anticipating some short-term consolidation and warn our growing audience to tread very carefully and their own risk. We reiterate that we do not have a crystal ball and past performance is never indicative of future performance.
If you enjoy reading our updates and analysis then start following us on Twitter.
A follow up to this next Flash Alert may be found here.
Anyone interested in reading our previous updates may do so here as they remain valid and provide a good trail for anyone wanting to catch up.
If you’re thinking about trading bitcoin then visit our bitcoin price analysis page. Here we periodically provide interesting bitcoin price insights and analyses that every crypto trader and investor should be aware of.
