Disclaimer: All of the content written on CoinMarketExpert is unbiased and based on objective analysis. The information provided on this page should not be construed as an endorsement of cryptocurrency, a service provider or offering and should neither be considered a solicitation to buy or trade cryptocurrency. Cryptocurrencies carry substantial risk and are not suitable for everyone. No representation or warranty is given as to the accuracy or completeness of this information and consequently, any person acting on it does so entirely at their own risk. See further disclaimer at the bottom of the page.
Bitcoin Price Analysis: Monday 27th April, 2020
What happened after our Bitcoin update on 20th April?
As at the time of writing today, Bitcoin was trading at $7,670, representing an increase of approximately 9.3% over last week’s level.
However, it hasn’t been all plain sailing for Bitcoin. Let’s break it down.
Sometime after our update last week we saw the price of BTCUSDT ease to an intra-day low of $6,766 on Binance before reaching a lower intra-day low of $6,751 the following day. What’s very interesting is that these levels seem to coincide with the rising wedge support line, as may be seen (up and close) on the 4-hour chart below.
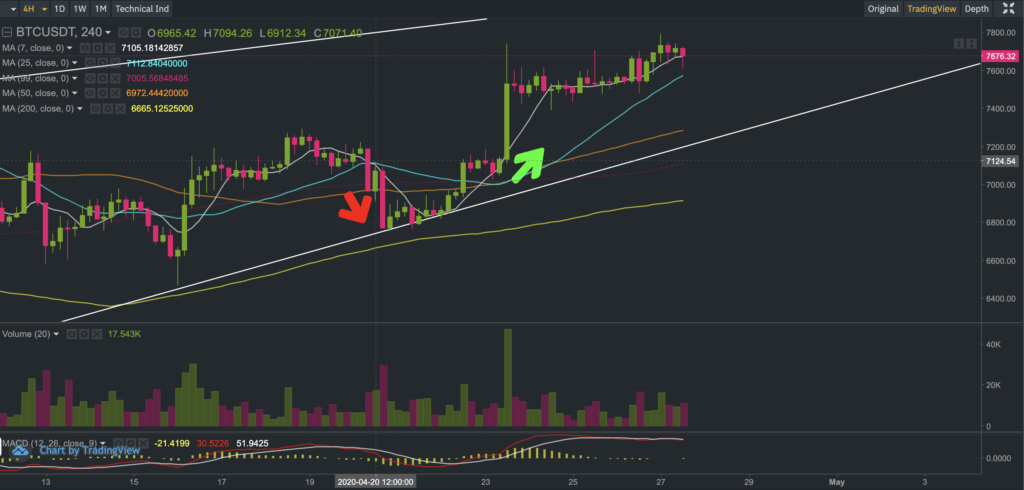
Then between Wednesday 22nd April until now, we have seen buyers re-emerge to keep the price of Bitcoin afloat around the 7-period simple moving average on the 4-hour chart.
So where do we stand from here?
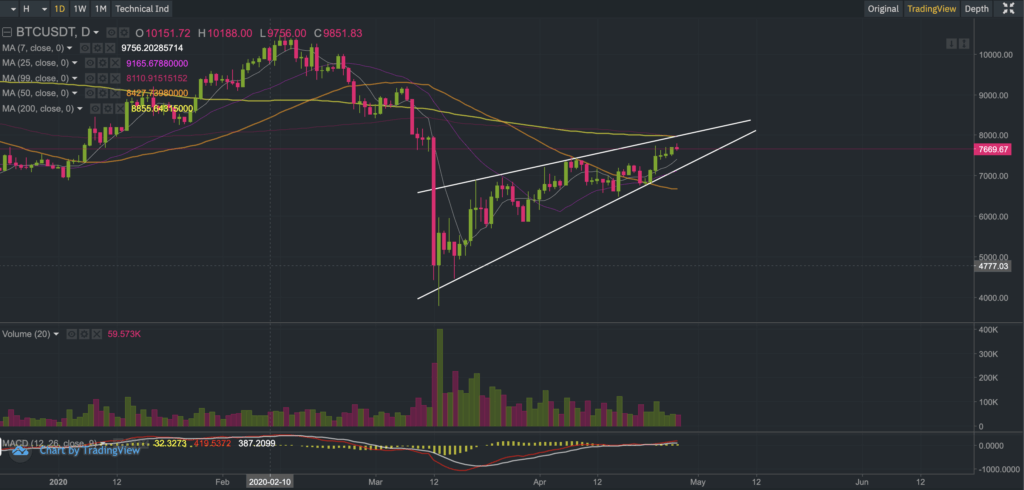
We are seeing some caution creep back into the market, as the price of Bitcoin approaches the 200-day simple moving average (yellow line on the daily chart below).
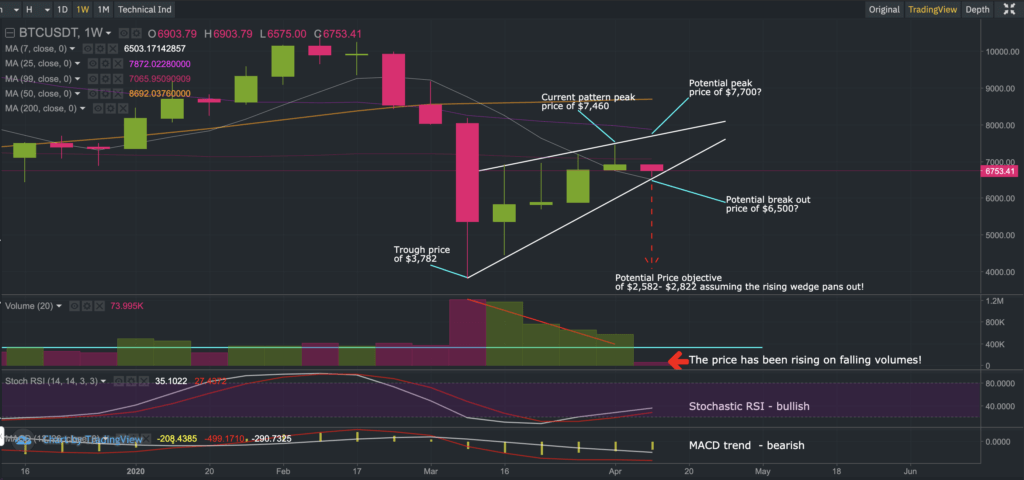
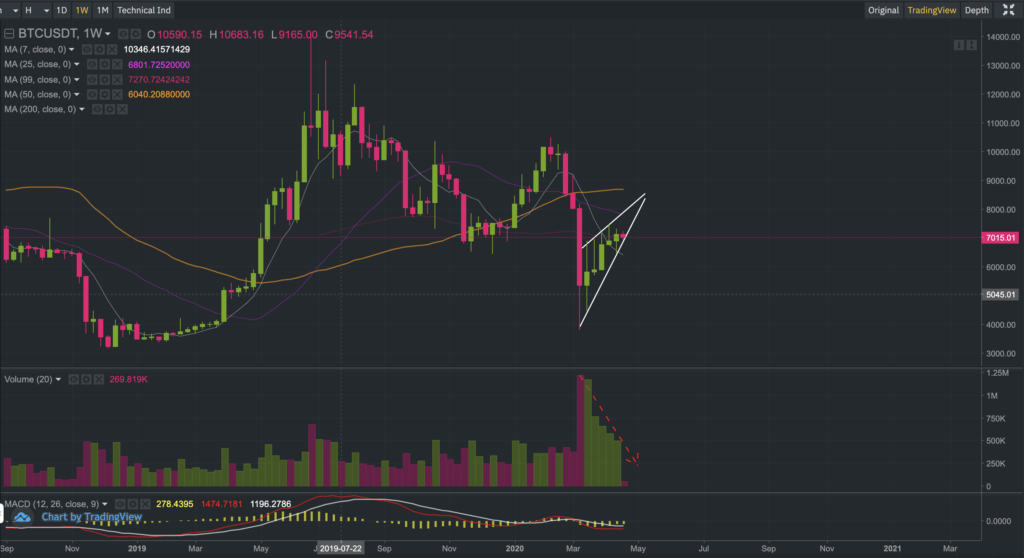
And on the weekly chart, we continue to see the same red flags i.e. a rising price on the back of lower volumes. Currently, we are also seeing some resistance around the 25-period moving average (light blue line) on the weekly-chart.
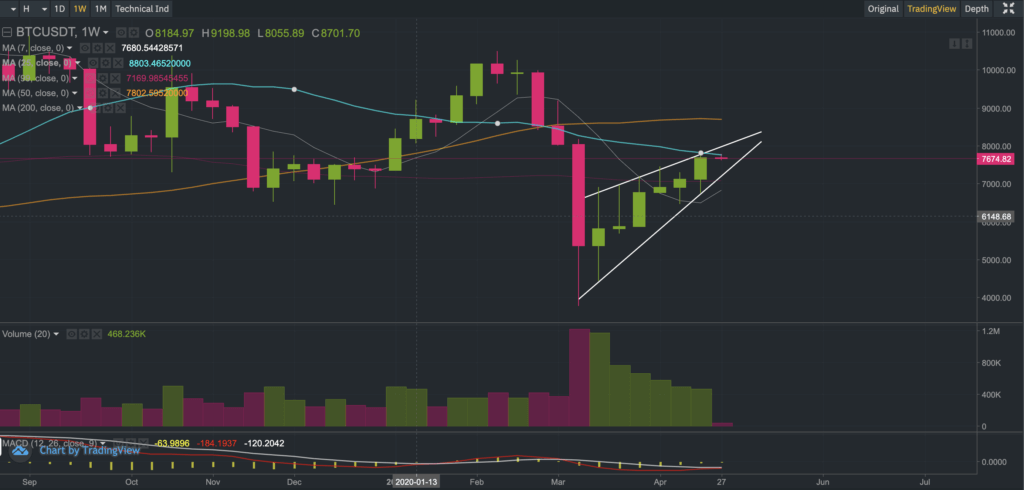
A rising wedge formation typically results in a bearish outcome. You may be asking yourselves whether a bearish outcome could occur right before an important halving? Well, there’s always a first time. Seasoned traders will know that it is not uncommon to “buy the rumor and sell the fact.” Anything is possible of course so you need to think carefully about your risk management.
On the other hand, there are some potentially encouraging signs. Looking at the MACD on the weekly chart, we see a bullish crossover. There is a tendency for MACD crossovers on the weekly chart to follow through quite well. But before getting too excited we would want to see whether Bitcoin is capable of closing above the 200-day simple moving average, which resides just below $8,000.
Let’s also not forget there is a CME price gap between $8,280-$9,060. Should Bitcoin manage to rise to $8,280, a $780+ rally could unfold!
However, at this juncture, most traders will be looking for evidence of support or resistance at the 200-day moving average as a means to understand whether a bullish or bearish trend is likely to ensue. Smart traders might even be considering put options on Binance to hedge their long exposures.
We believe the 200-day moving average could really ‘make or break’ Bitcoin in the short term, but let’s see! Whatever it is, we seem to be approaching a very exciting period for Bitcoin!!!
We hope you found our Bitcoin commentary interesting and educational. As always, trade safely, and at your own risk.
We dedicate our time to making our commentaries educational and insightful so that you can obtain different angles that improve your decision making, so please do show us some love by following us on Twitter and/or Reddit and sharing our commentaries.
The next Bitcoin commentary will be published on Monday 4th May 2020 (approx one week before the expected halving date).
Develop your understanding of trading with our free educational guide that walks you through the five rules you need to master before trading crypto.