Disclaimer: All of the content written on CoinMarketExpert is unbiased and based on objective analysis. The information provided on this page should not be construed as an endorsement of cryptocurrency, a service provider or offering and should neither be considered a solicitation to buy or trade cryptocurrency. Cryptocurrencies carry substantial risk and are not suitable for everyone. No representation or warranty is given as to the accuracy or completeness of this information and consequently, any person acting on it does so entirely at their own risk. See further disclaimer at the bottom of the page.
Bitcoin Price Analysis: Monday 13th April, 2020
What happened after our Bitcoin update on 6th April?
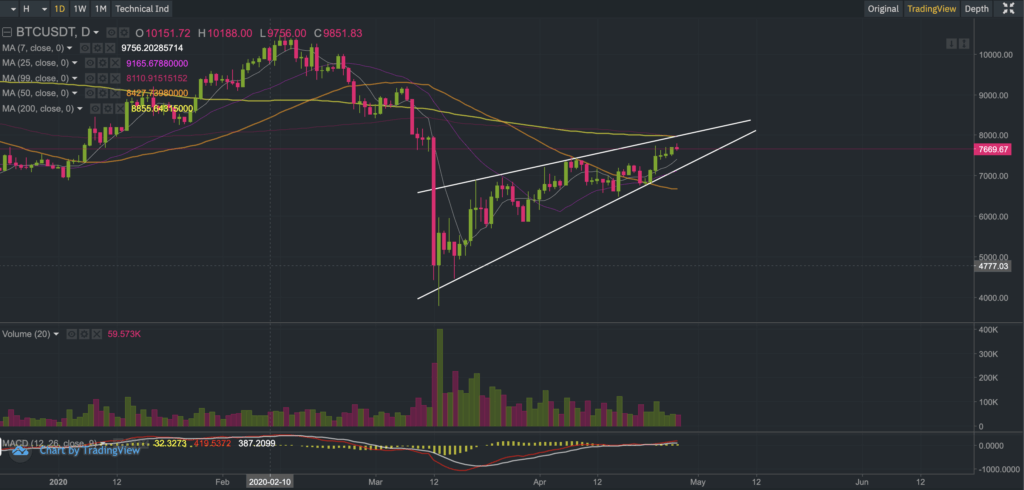
At the time of writing the previous update, Bitcoin had broken through the psychological $7,000 level following previous multiple attempts. This breach had reinvigorated appetite and paved the way for the price of Bitcoin to reach an intra-day high of $7,460 a day later on 7th April.
At $7,460 Bitcoin saw sellers re-emerge. This coincided with the 50-day moving average, which was tested on another 4 occasions on the 8th, 9th, 10th, and 12th of April without much luck for the bulls!
The chart below clearly illustrates the 50-day moving average (orange line) acting as a formidable resistance level for Bitcoin over the past week.
“Bitcoin’s reluctance to close above the 50-day moving average, despite numerous attempts, has dented bullish sentiment. It is one of the main reasons why we are seeing Bitcoin back below the $7,000 again.”
CoinMarketExpert
So where do we stand from here?
A short-term rebound cannot be discounted
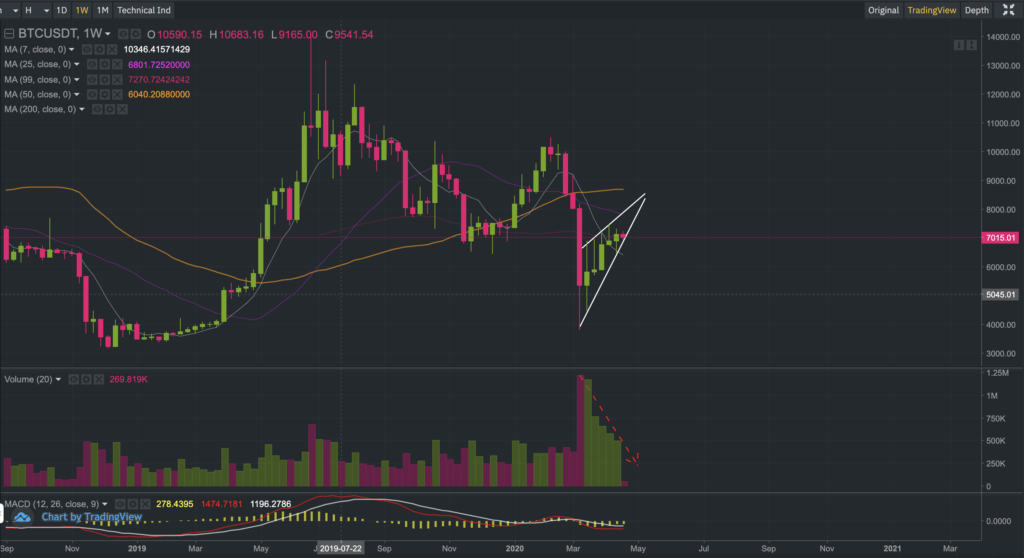
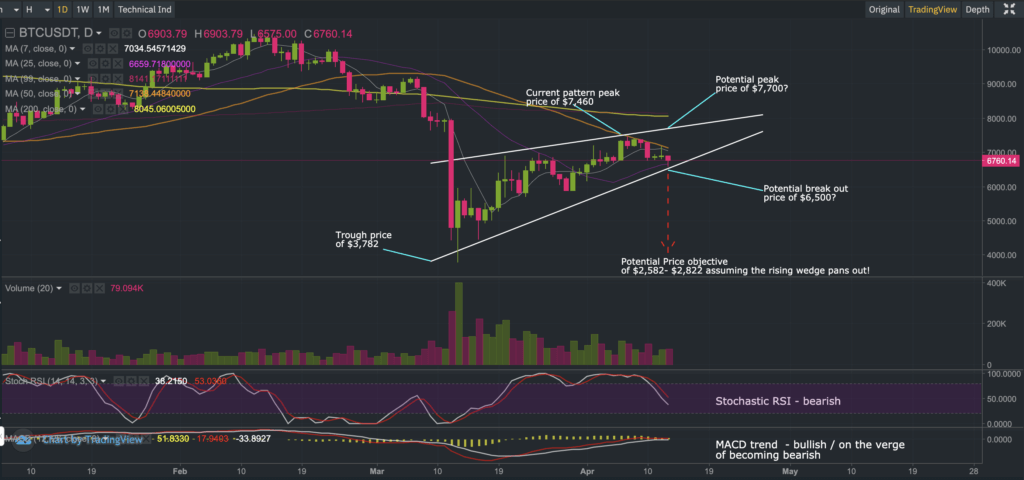
Bitcoin is currently trading on the floor of this rising wedge formation. However, it is very encouraging to look at the 4-hour chart and see good support come through so maybe a rebound could be in store?
If a rebound does materialize, all eyes will be glued on the 50-day moving average again. However, failing to close above the 50-day moving average (for a sixth time) will likely spell big trouble for the bulls out there – so tread carefully!
Bitcoin price objective revised lower
In a recent article, the price objective for a bearish rising wedge pattern was calculated and a potential price range of $2,782 – $3,328 was derived.
A week has passed since that update so using the additional market data, a targetted move of around $3,678 – $3,918 has been recalculated with a hypothetical price objective of $2,582 – $2,822.
This clearly indicates that Bitcoin’s potential downside risks are increasing as the price reaches new highs within the current rising wedge formation.
In the greater scheme of things, there are many permutations of how this can pan out for Bitcoin. Nobody has a crystal ball!
Risk management is always important!
We hope you found this Bitcoin commentary to be interesting and educational. As always, trade safely, and at your own risk.
A lot of time is dedicated to making these commentaries educational and insightful so that you may obtain different angles that may improve your decision making, so please do show some love by following CoinMarketExpert.com on Twitter and/or Reddit.
The next Bitcoin commentary will be published on Monday 20th April 2020.
Develop your understanding of trading with our free educational guide that walks you through the five rules you need to master before trading crypto.