Disclaimer: All of the content written on CoinMarketExpert is unbiased and based on objective analysis. The information provided on this page should not be construed as an endorsement of cryptocurrency, a service provider or offering and should neither be considered a solicitation to buy or trade cryptocurrency. Cryptocurrencies carry substantial risk and are not suitable for everyone. No representation or warranty is given as to the accuracy or completeness of this information and consequently, any person acting on it does so entirely at their own risk. See further disclaimer at the bottom of the page.
Bitcoin Price Analysis: Monday 20th April, 2020
What happened after our Bitcoin update on 13th April?
Bitcoin is trading at pretty much the same level seen last week, which isn’t really a bullish sign at all.
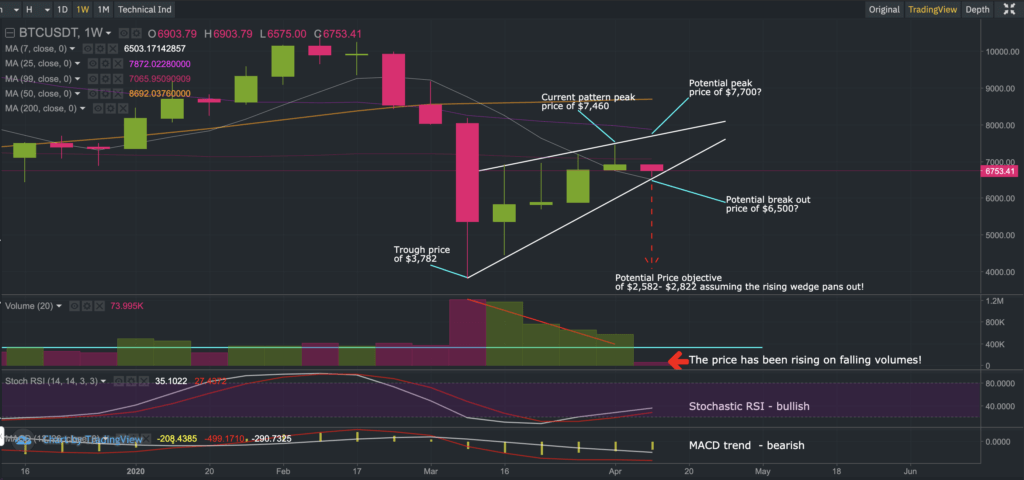
We saw BTCUSDT dip to an intra-day low of $6,468 on Thursday, temporarily breaching support of the rising wedge formation, before encountering a new wave of buyers that momentarily helped prop up the price through that stubborn 50-day simple moving average.
Nonetheless, buying momentum seemed to run out of steam rather quickly, with sellers between $7,260-$7,290 on Saturday and Sunday halting Bitcoin’s progress and consequently dragging it back towards the $7,000 level.
So far today, we are seeing Bitcoin struggle to maintain ground at the $7,000 level (again). And all of this price action is happening with lower weekly trade volumes, as may be seen in the main chart above.
So where do we stand from here?
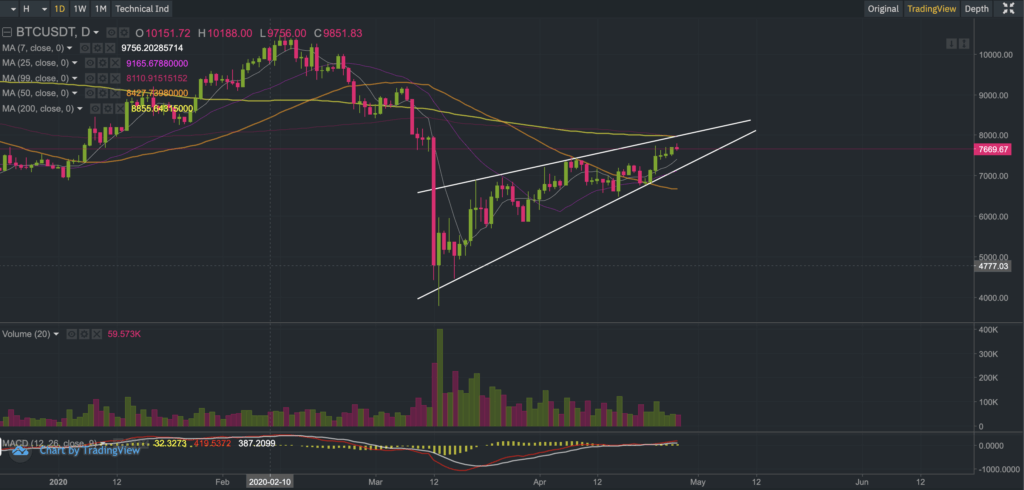
The daily chart (below) shows the price of Bitcoin trading above the 50-day simple moving average of $6,870. If you recall from last week’s commentary, Bitcoin had struggled a lot around this level so it would be really interesting to see whether buyers start to resurface to rescue Bitcoin.
Source: TradingView/Binance/CoinMarketExpert.com
Should buyers fail to re-emerge around the $6,870 level, then there’s still some hope of a recovery with all eyes turning to the 200-period moving average of $6,670 on the 4-hour charts (below).
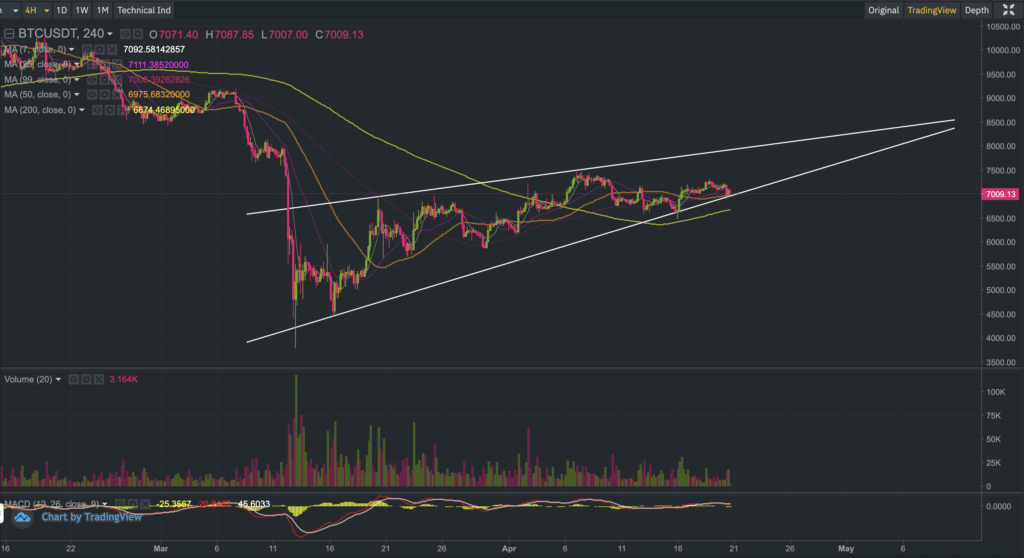
Source: TradingView/Binance/CoinMarketExpert.com
Failing to attract buyers around the $6,670 region could spell big trouble for the bulls, unfortunately. In which case, you may want to revisit the technical price objectives identified in our previous commentary as the risk of massive sell-off unfolding rises exponentially.
In the greater scheme of things, anything can happen. There are many permutations of how this can pan out for Bitcoin. Nobody has a crystal ball! As always, trade safely, and at your own risk.
A lot of time is dedicated to making these commentaries educational and insightful so that you may obtain different angles that may improve your decision making, so please do show some love by following CoinMarketExpert.com on Twitter and/or Reddit.
The next Bitcoin commentary will be published on Monday 27th April 2020.
Develop your understanding of trading with our free educational guide that walks you through the five rules you need to master before trading crypto.