Disclaimer: All of the content written on CoinMarketExpert is unbiased and based on objective analysis. The information provided on this page should not be construed as an endorsement of cryptocurrency, a service provider or offering and should neither be considered a solicitation to buy or trade cryptocurrency. Cryptocurrencies carry substantial risk and are not suitable for everyone. No representation or warranty is given as to the accuracy or completeness of this information and consequently, any person acting on it does so entirely at their own risk. See further disclaimer at the bottom of the page.
Bitcoin Price Analysis: Monday 4th May, 2020
What happened after our Bitcoin update on 27th April?
At the time of writing today, the price of BTCUSDT was trading at $8,823, down from an earlier high of $8,936.
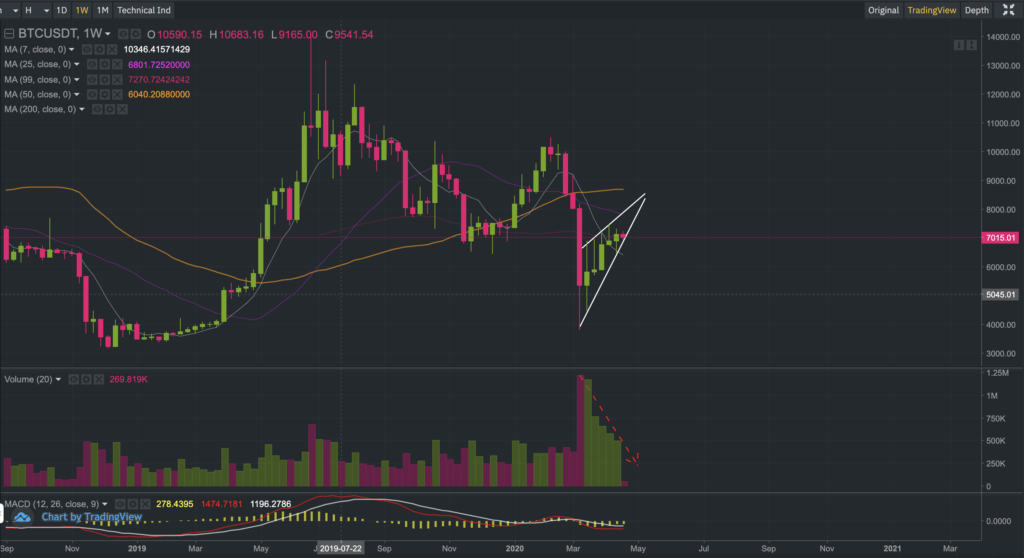
We saw the price of BTCUSDT rally to an intra-day high of $9,460 three days after our update, breaking through the resistance level of what was perceived to be an ascending wedge formation. This type of pattern typically results in a bearish outcome – although it was clearly not the case this time around!
After reaching an intra-day high of $9,460 on Thursday last week, we have seen Bitcoin pare most of its gains, reaching an intra-day low of $8,522 earlier today, where some buyers re-emerged to energize Bitcoin.
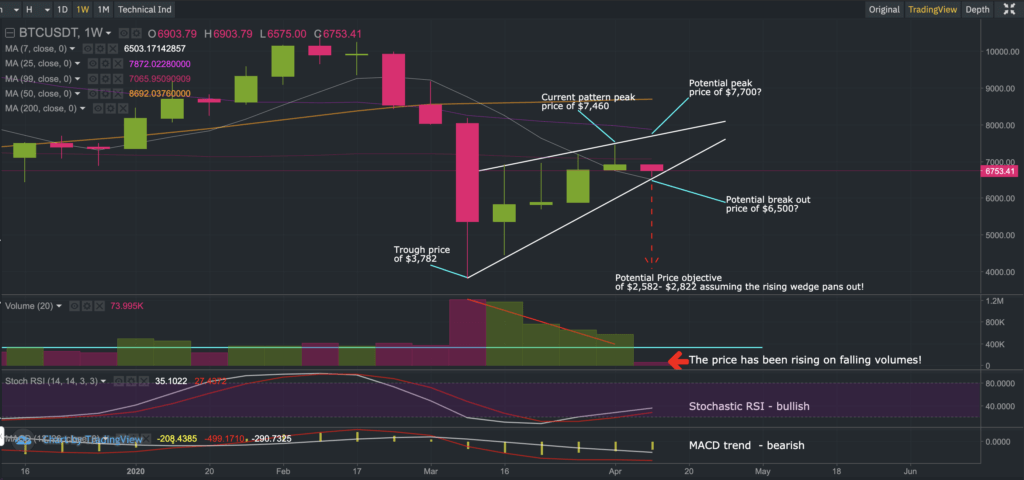
In our commentary last week we made 3 important points worth reiterating:
(1) We mentioned that the MACD on the weekly chart was showing a bullish crossover. We observed that these crossovers (on the weekly chart) have had a tendency to follow through quite well.
(2) we stated that most traders will be looking for evidence of support or resistance at the 200-day moving average as a means to understand whether a bullish or bearish trend is likely to ensue.
(3) We also pointed out that there was a CME price gap between $8,280-$9,060 and that if Bitcoin manages to rise to $8,280, a $780+ rally could unfold!
So where do we stand from here?
Point 1 remains intact, with the weekly chart continuing to show a bullish MACD crossover;
Point 2 has been validated, with the price of Bitcoin trading above the 200-day moving average and;
Point 3 has been validated too, as the CME price gap has been filled.
So, based on the above observations, one could argue that Bitcoin may really be entering a bullish cycle in the run-up to its halving date.
However, we have not been completely convinced about the next halving period. There’s a gut-wrenching feeling that something is not entirely right.
Could our opinion have been biased by an earlier observation made 8 months ago in the following research post: Bitcoin Price Analysis: Pre & Post Halving Event Performance
In order to understand whether more people are becoming interested in Bitcoin, we looked at search interest using Google Trends. We specifically set custom dates to capture interest during previous halving periods, and the data seems to suggest that interest for the key ‘Bitcoin’ terms has been dwindling.
2012 Bitcoin Halving: Google Trends
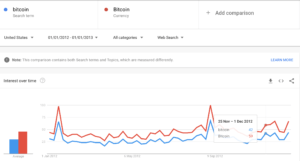
We note that back in 2012, the Google index score for Bitcoin (term) was 42 and for Bitcoin (Currency) it was 59.
2016 Bitcoin Halving: Google Trends
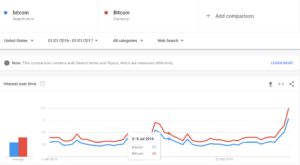
We note that in 2016, the Google index score for Bitcoin (term) was 37 and for Bitcoin (Currency) it was 48.
2020 Bitcoin Halving: Google Trends
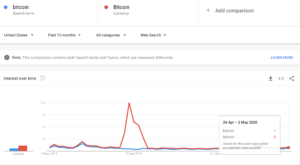
And currently, the Google index score for Bitcoin (term) is only 7 and for Bitcoin (Currency) it is 8.
When we look at the overall picture ( price trends, moving averages, search interest) it is really a mixed bag at the moment so at this juncture we prefer to remain cautious. We would also encourage our readers to review the research/observations we made 8 months ago as they continue to maintain some merit.
In the meantime, we will continue to look at other indicators such as the Bitcoin hash rate for clues on potential price direction. We note that over the past couple of weeks, the Bitcoin hash rate has worked well as a leading indicator for identifying when short-term price trends may change direction.
We hope you found our Bitcoin commentary interesting and educational. As always, trade safely, and at your own risk.
We dedicate our time to making our commentaries educational and insightful so that you can obtain different angles that improve your decision making, so please do show us some love by following us on Twitter and/or Reddit and sharing our commentaries.
The next Bitcoin commentary will be published on Monday 11th May 2020 (one day before the halving date!).
Develop your understanding of trading with our free educational guide that walks you through the five rules you need to master before trading crypto.