Flash Alert: Sunday 1st September
Over the last 7-days, BTC/USDT traded between a high of $10,604 and a low of $9,320. At the time of writing today, the price of BTC/USDT was trading in a narrow range of $9,566-$9,580.
In our previous Flash Alert dated Thursday 29th August, we noted that if price of BTC/USDT breaches $9,400 then we would likely see a descent to $9,165-$9,060.
We note that BTC/USDT has fallen to a low of $9,320 although the lower thresholds have not yet materialised. We continue to note that $9,400 remains an important level for BTC/USDT although it is the closing price on the candlesticks that will provide conviction towards a lower move to $9,165-$9,060.
Monthly Chart: BTCUSDT
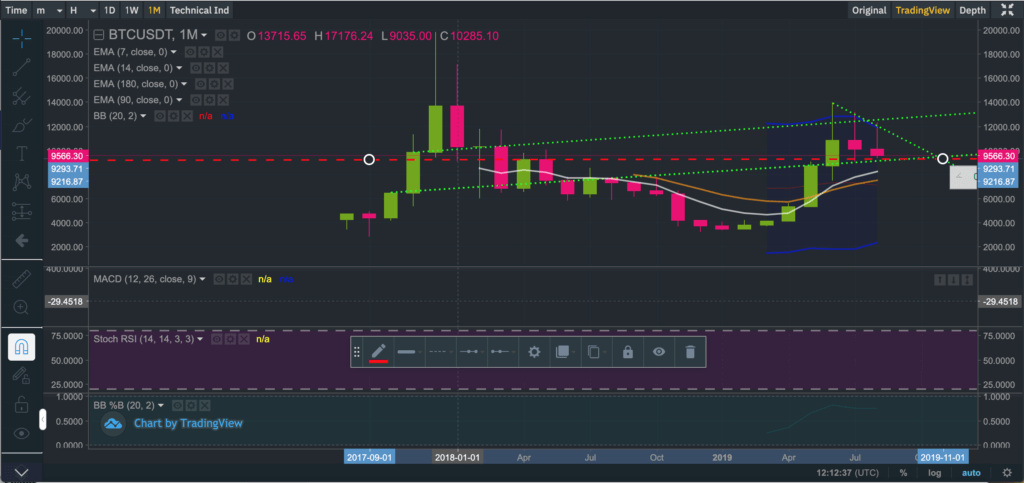
BTCUSDT remains within an ascending channel
From June to date, we have seen the price of BTC/USDT descend from a high of $13,970 to a low of $9,320. Despite the bearishness over this period, BTC/USDT remains within an ascending channel, as seen by the (green dotted line) on the chart above. This means there is still hope for the Bitcoin bulls but….
Be fearful of the $9,216 level
The $9,216 (where the red dashed line and green dotted line coincide) on the chart above is an important level to watch for. A ‘close‘ below this level had ended the previous Bitcoin bull market and may very well jeopardise the current bullish wave if it were to reoccur.
We are being very specific when we say ‘close‘ because what we are actually referring to is a price close on the candlestick chart, as seen on Binance. In the past it was not uncommon to see the intra-day price temporarily breach $9,216, although a temporary breach does not carry the same weight as an actual close – and therefore it is important we differentiate between a simple breach and a proper close. The devil is in the detail.
If BTC/USDT closes below $9,216, it is very likely the price will consolidate further.
The battle of the Bitcoin Bulls and Bears intensifies
In a bull market cycle the price reaches higher highs (and higher lows) within consecutive waves. But if we look at the chart above, it does not really appear to be characteristic of a proper bull market – not just yet at least.
Let us all acknowledge there were many people who bought Bitcoin during the recent pumps for fear of missing out on an extended rally – and after all can we really blame them for thinking that when there were so many claims of Bitcoin being materially undervalued .
It therefore stands to reason there are many people sitting on losses and quite possibly looking to breakeven or even minimise the losses on their Bitcoin holdings. This means we cannot rule out the possibility of the current wave becoming a failed bull market.
HOWEVER, at the same time we believe the current wave is not yet complete until the channel (shown above in the green dotted lines) is breached with a proper price close.
Therefore, we are waiting for BTC/USDT to close below $9,216 before perceiving this wave as being a failed attempt to establish a bull market. We note that if BTC/USDT manages to find traction and the price manages to close above $12,500 – $13,000 over the coming week or two, a strong bullish wave would be confirmed.
What could provide price support for BTCUSDT?
As mentioned in our previous posts, Bitcoin’s block rewards are due to halve in May 2020. We have observed that historically Bitcoin has exhibited a strong rally 6 months prior to the halving date – and that coincides with October/November 2019 – and that’s only one-to-two months away.
Anyone interested in our observation of the Litecoin and Bitcoin historical price reaction to the halving of their block rewards may read the post here.
Weekly Chart: BTCUSDT
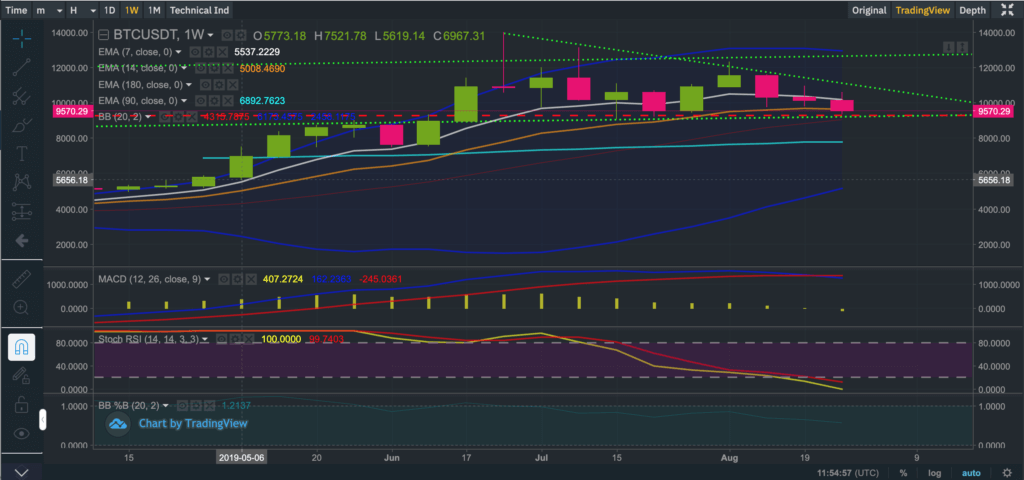
We note there are conflicting signals between our favourite indicators – the MACD and the RSI on the weekly chart.
EMA crossovers remain bullish although at the time of writing the price was below the 14-day EMA (orange line) of $9,653. Bulls will definitely want to see the price of BTC/USDT re-establish itself above the 7-day EMA (currently $10,171) over the coming week or two.
Daily Chart: BTCUSDT
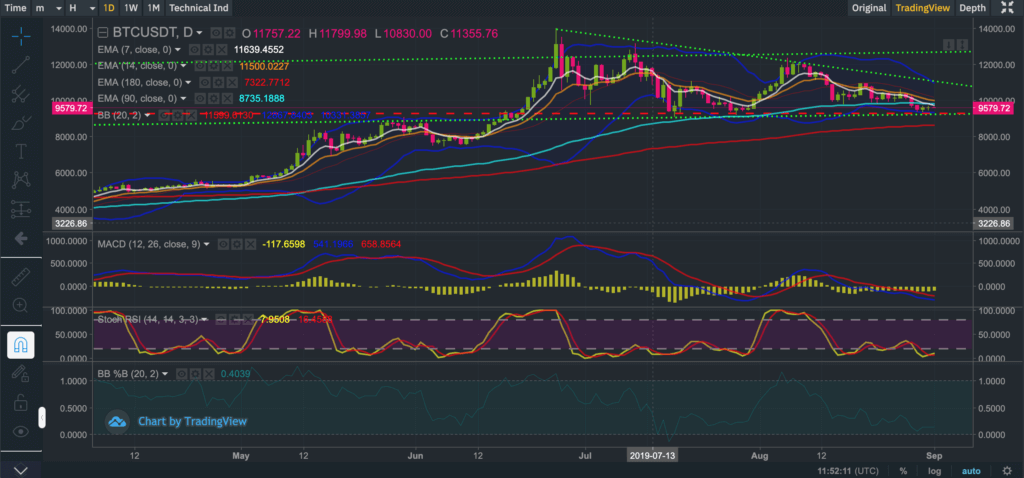
We can see the 7-day EMA (white line) crossing the longer term 90-day EMA (light blue) from above, which is typically a bearish sign. We note nevertheless that this is not as bearish as when the 90-day EMA crosses the 180-day EMA from above.
On the daily chart, we note the MACD (12, 26,9) remains bearish although the RSI (14,14,3,3) provides an ‘oversold’ signal – so conflicting indicators again.
Hourly Chart (12H): BTCUSDT
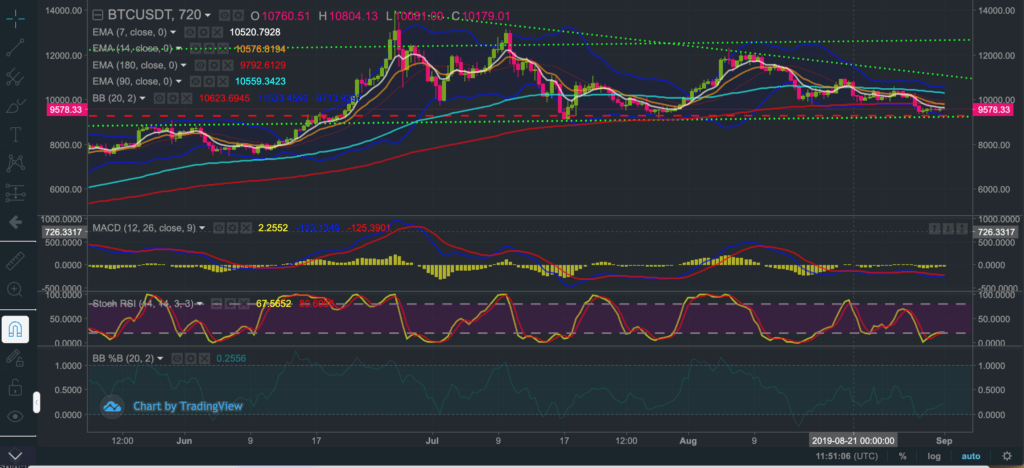
On the 12-hour chart, we can see the price of BTC/USDT struggling to close above the 7-day EMA (white line), currently at $9,617. Until that happens, the bias will remain to the downside with the $9,216 level remaining an extremely important pivotal point for Bitcoin.
A follow up post to this Flash Alert may be found here.
If you enjoy reading our updates and analysis then start following us on Twitter.
If you’re thinking about trading bitcoin then visit our bitcoin price analysis page. Here we periodically provide interesting bitcoin price insights and analyses that every crypto trader and investor should be aware of.
