Flash Alert: Thursday 29th August
Some of the technical targets identified in our Flash Alert dated Wednesday 28th August materialised today.
BTC/USDT traded at a high of $9,724 today before plunging $404 to $9,320. BTC/USDT struggled to make a proper recovery, and for the rest of the day traded between $9,400 and $9,500. As a matter of fact, at the time of writing BTC/USDT was trading at $9,495.83;
Bitcoin bearishness is likely to intensify
- As a brief reminder, in yesterday’s Flash Alert we had mentioned that breaching the 90-day EMA suggests Bitcoin is likely to suffer further selling pressure and at the time we were eyeing the $9,555 – $9,400 levels, which is roughly in line with the current price range of BTC/USDT today;
- We also pointed out that if BTC/USDT breaches $9,400 will see the price descend even further to $9,165 – $9,060 and if support does not re-emerge at those levels then we will see further declines to $8,760 – $8,567;
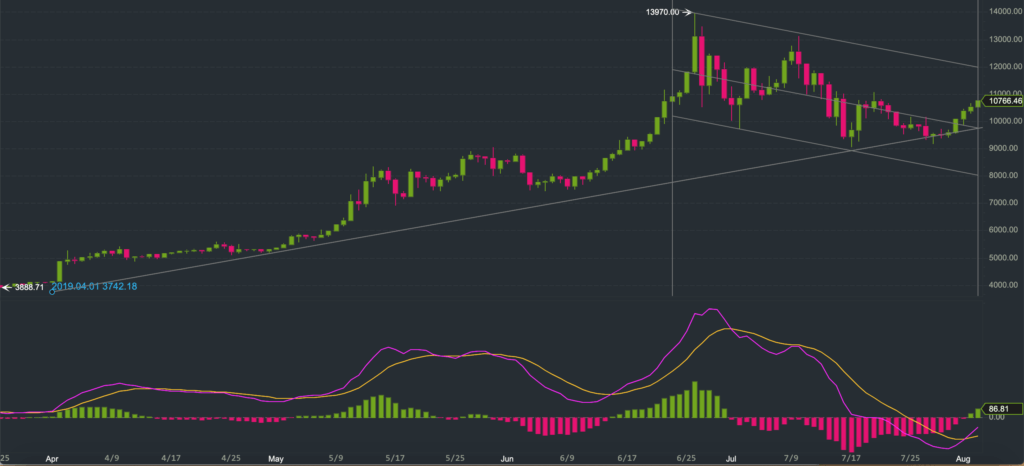
- The breaching of the 90-day EMA on the daily chart today is a bearish sign and it typically suggests that further declines are in store. If BTC/USDT breaches today’s low of $9,320 over the next 24-48 hours we will most likely see sharp declines towards the levels identified above;
- In the meantime, the MACD (12,26,9) remains bearish on the daily chart;
But not before a short-term price rebound
- Given the magnitude of today’s decline we are most likely going to see BTC/USDT enjoy a temporary reprieve over the next 24-48 hours. This means it is entirely possible over this period to see the price of BTC/USDT rebound to the $9,590 -$9,850 area. Once the price reaches this range we expect momentum to slow, and at that point it is possible to see BTC/USDT switch back into bearish mode and resume its decent;
- In the meantime, the Stochastic RSI (14,14,3,3) is bearish on the daily chart although it is also appearing oversold. This typically suggest a price rebound may be forthcoming;
- We also note the price of BTC/USDT is trading at the lower Bollinger Band on our chart, which reinforces the view that there may be some sort of a rebound over the next 24-48 hours.
There is still some hope for Bitcoin as the bullish uptrend that started in February remains intact so far
- Despite recent moves, the overall bullish trend that had started in Q1 of this year remains intact. As long as the price of BTC/USDT remains above the 180-day EMA there is still hope for Bitcoin to reach new highs;
- Also, let’s remember that Bitcoin’s block rewards are due to halve in May 2020. We have observed that historically Bitcoin tends to exhibit a strong rally 6 months prior to the halving date – and that coincides with October/November 2019 – which is just around the corner;
- Anyone interested in our observation of the Litecoin and Bitcoin historical price reaction to the halving of their block rewards may read the post here.
- A follow up post to this Flash Alert may be found here.
If you enjoy reading our updates and analysis then start following us on Twitter.
If you’re thinking about trading bitcoin then visit our bitcoin price analysis page. Here we periodically provide interesting bitcoin price insights and analyses that every crypto trader and investor should be aware of.
