Flash Alert: Friday 6th September
So far this week, BTCUSDT traded between a high of $10,905.87 and a low of $9,712.5 on Binance. At the time of writing BTCUSDT was trading at 10,884, representing a 3% increase from the prior day’s close on Binance and a 11.9% surge over the previous week.
The billion dollar BTC transfer
Where could it have gone to?
It was a hot topic of discussion today as 94,500 bitcoins (approx US$ 1 billion) transaction was reported to have taken place around 03:30:05 UTC. This transaction is said to have been one of the largest ever recorded on the Bitcoin blockchain.
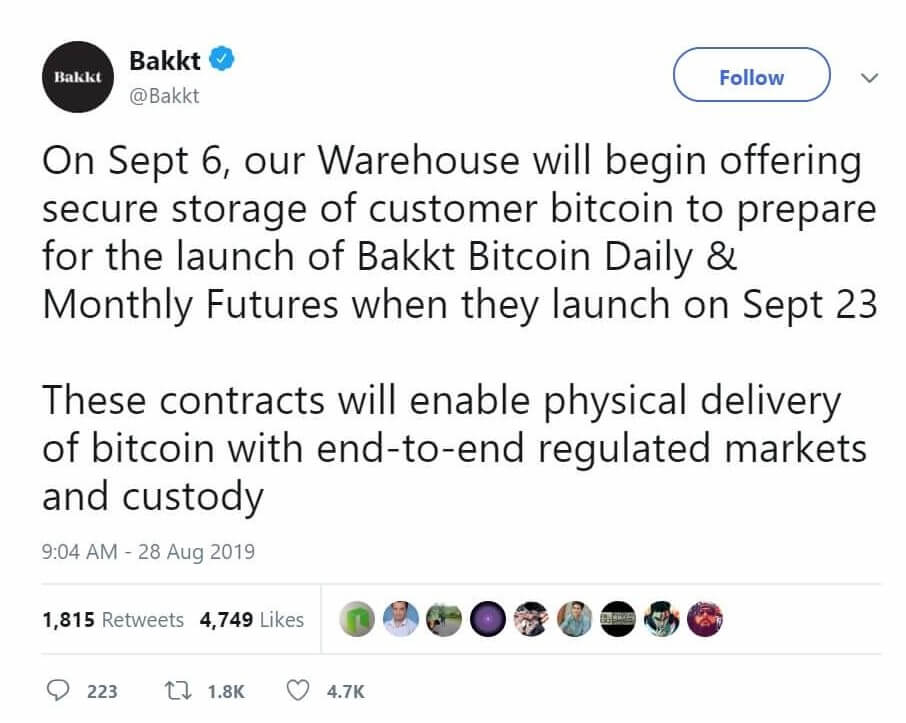
As you can imagine there was a lot of speculation about the origin of this transaction as well as its purpose. Certain market participants claimed it was due to funds moving into the Bakkt Warehouse, the world’s first exchange to offer a physical delivery for Bitcoin.
In a tweet on 28th August, Bakkt had announced plans to start accepting client deposits on 6th September (today) and to commence trading from 23rd September.
And who could it have been?
It is hard to say precisely who, although it is interesting to note that more institutional money is flowing into Bitcoin, which is positive news.
An article published on the Financial Times precisely one week ago reported that a firm owned by billionaire trader Alan Howard is planning to launch a $1bn venture that will put money in a range of cryptocurrency hedge funds.

It was reported that Elwood Asset Management, the manager of the personal crypto assets of Mr Alan Howard, is working on a platform that would design portfolios of crypto funds for institutional investors.
So, where is Bitcoin heading to next?
Let’s briefly recap of our previous update
In the week ahead update published on Sunday 1st September, we pointed out a few bullish and bearish observations.
Bullish observations
We had noted that BTCUSDT remains within an ascending channel on the monthly chart and that it provides hope for the Bitcoin bulls.
We had also stated that if BTCUSDT manages to find traction and the price manages to close above $12,500 – $13,000 over the coming week or two, a strong bullish wave would be confirmed.
And we had also observed that Bitcoin has historically exhibited a strong rally 6 months prior to the halving date. This implies that if we had to count backwards, we would expect BTCUSDT to stage a rally sometime between October and November 2019 – which is only around the corner.
Separately, our CoinMarket Scanner had also picked up on the Bitcoin bullishness earlier this week, clearly stating that “Bullish MACD crossovers [had been] spotted” [and that] “bullish sentiment is very likely to persist” – as seen here
Bearish observations
We had noted at the time that we could not rule out the possibility of Bitcoin being in a failed bull market after breaching the 90-day EMA although we had also noted that it could not be confirmed until BTCUSDT closes below $9,216.
“Therefore, we are waiting for BTC/USDT to close below $9,216 before perceiving this wave as being a failed attempt to establish a bull market”
We had observed that BTCUSDT was struggling to close above its 7-day EMA of $9,617 at the time and bearish sentiment appeared to be intensifying.
Fast forward to Friday 6th September
All eyes are on the descending wedge formation at the moment, and we note that today’s high actually breached the upper resistance level, as seen on the chart.
It would be interesting to see whether BTCUSDT can retest today’s highs of $10,905.87 over the weekend and actually close above this level to confirm the continuation of the bullish trend that had begun toward the end of Q1 of this year.
In the meantime, we can see that overall price trends for Bitcoin remain firmly bullish:
- the price of BTCUSDT appears to have settled above its short-term moving averages;
- the 7-day moving average is seen crossing the 25 and 99 day moving averages from below;
- The MACD crossover remains bullish;
- And the breaching of the $10,900 level is also seen as a positive sign that could suggest Bitcoin is near to a break out. We note that we would want to see a close above $10,900 (and not simply a temporary breach) on the daily charts before confirming our bullish conviction.
Despite the bullish price trends, it is worth mentioning that given the weekly rebound it is entirely possible to see some short-term profit taking in Bitcoin.
RSI’s are beginning to appear ‘overbought’ whilst at the same time we note the price is touching the upper the Bollinger band on the daily charts, which usually suggests that some selling pressure may ensue – although certain traders may perceive any weakness to be temporary and quite possibly an exciting entry point opportunity for themselves.
A follow up post to this Flash Alert may be found here.
If you’re thinking about trading bitcoin then visit our bitcoin price analysis page. Here we periodically provide interesting bitcoin price insights and analyses that every crypto trader and investor should be aware of.
