Bitcoin Price Analysis: BTC poised for a big move.Which way will it be?

Flash Alert: Monday 4th November
Since our previous update the price of Bitcoin has continued to find support around the 200-day simple moving average, which is encouraging for the bulls. But there are a few concerning signs that we want to bring to your attention – so keep reading.
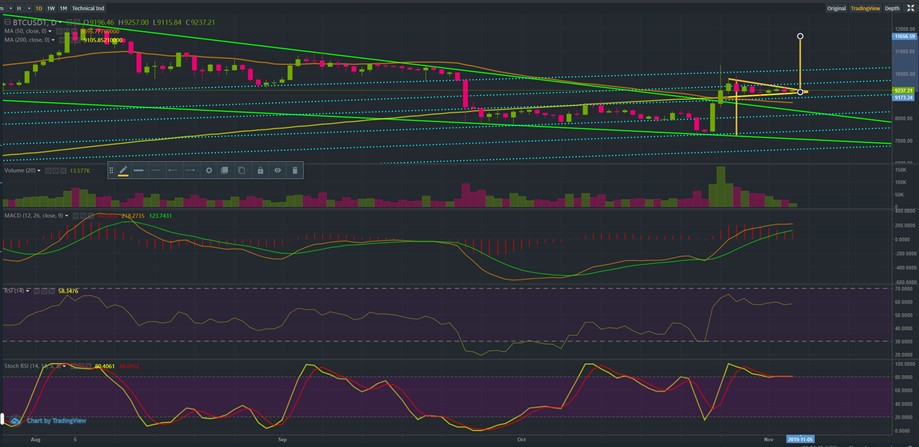
At the time of writing this update, the price of Bitcoin was trading at $9,237.21, up from an earlier intra-day low of $9,115.84 although slightly below an intra-day high of $9,257.
As noted, buyers have been emerging to prop up the price of Bitcoin whenever it dipped towards the 200-day moving, currently at $9,105.85, which is of course very bullish to see.
Bitcoin supported on thinning buy volumes
But we are also noticing a decline in buy volumes for BTCUSDT on Binance. In an ideal scenario, it would have been healthier to see the price supported by rising buy volumes, although this does not seem to have been the case.
Bitcoin needs a big move to shrug off death cross
We continue to note the 200-day and 50-day moving averages are still showing a death cross on the charts. Furthermore, over the past week we have seen Bitcoin make a series of lower intra-day highs, which is beginning to dampen sentiment.
Unless there is a catalyst that triggers a big move to the upside very soon, we may see this rebound falter!
Bitcoin triangle formations
Drawing triangles on a chart is surely creative and fun although it is also subject to many interpretations.
Certain traders will see a wedge formation one day a symmetrical triangle the next. Others may see a bullish flag or pennant and even provide a mathematical explanation to distinguish one pattern from the other.
But let’s face it – in the greater scheme of things, Bitcoin is not exactly the most liquid market and it is certainly not free from market manipulation either.
So lets try to make sense of the different triangular formations and the activity we are currently seeing to form an opinion.
The bearish view
One could argue there is a symmetrical triangle formation on the charts, which usually indicates market indecision.
Indecision is not necessarily bullish or bearish. It could go both ways, although given the context, price action risks becoming skewed towards the downside.
If we look at context and the technical indicators, the stars are not exactly aligned.
- there is still death cross on the charts, which is bearish;
- the 14-day RSI is very close to ‘overbought’ territory;
- the stochastic RSI and MACD that are both becoming less bullish on the daily charts;
- buy volumes at the 200-day moving average have been declining and;
- most symmetrical triangles we have seen over the last couple of months have proven to be bearish (rather than bullish).
Over the last couple of days Bitcoin has made a series of lower intra-day highs, so failing to maintain ground above the 50 and 200-day moving averages (the death cross region), is likely to see sentiment rapidly turn bearish and Bitcoin knocked back into a full blown bear market.
Currently, we are watching closely to see whether the price of Bitcoin can continue to maintain ground above the death cross region. If it doesn’t, Bitcoin could see a big move towards $7,000, so tread very carefully!
The bullish view
One could interpret the triangle formations on the chart above as a bull flag or bullish pennant that could see price of Bitcoin breakout to the upside to reach $11,000 -$11,500.
This is our current base case scenario and it is purely conditional on the price of Bitcoin maintaining support above the death cross region.
We see on-going support at the 200-day moving average as being extremely encouraging for Bitcoin, and we also have a plausible explanation for the somewhat lower market volumes.
It is possible Bitcoin miners have been intentionally selling less Bitcoin (to cover their costs) in a bid to tighten the market and artificially inflate the price.
These actions would help raise the bullish mood in the run up to the halvening in the May 2020 and create the ideal conditions for miners to boost long-term profitability. Bitcoin miners are after all the biggest market participants that have a vested interest in seeing the price gradually rise.
Whilst the above is only a hypothesis, it helps us make sense of both the price action and volume activity we are seeing at the moment.
We maintain our bullish stance on Bitcoin although warn our growing audience to tread very carefully and their own risk. We reiterate that we do not have a crystal ball and past performance is never indicative of future performance.
If you enjoy reading our updates and analysis then start following us on Twitter.
A follow up to this next Flash Alert may be found here.
Anyone interested in reading our previous updates may do so here as they remain valid and provide a good trail for anyone wanting to catch up.
If you’re thinking about trading bitcoin then visit our bitcoin price analysis page. Here we periodically provide interesting bitcoin price insights and analyses that every crypto trader and investor should be aware of.