Flash Alert: Wednesday 11th December
First of all, we apologise for the delayed update. We were initially scheduled to release an update on Monday afternoon although postponed our commentary in the hope to see some interesting price action materialise without having to sound too repetitive.
The price of Bitcoin hasn’t really gone anywhere since the previous update last week although after some of you reached out directly to us, we decided to not postpone any further. It makes us happy to see our readership grow and flattered some of you have taken the initiative to make direct contact.
As conveyed in our previous update on 2nd December, and which is becoming even more evident over time, Bitcoin is finding weaker traction on each time a bounce occurs recently.
Furthermore, we are seeing increasing divergence between various indicators on the daily charts such as the RSI and MACD, which tends to provide a lack of market conviction.
Last week’s update hit the nail bang on the head! “When these conditions are present, there is a tendency for Bitcoin to trade sideways for a while although in the greater scheme of things the overarching theme remains skewed to the downside.”
Keep it simple stupid: the trend is your friend
The monthly chart, above, shows the price of Bitcoin well anchored in a bearish descending channel, with $6,000 looking like the next key level for Bitcoin to test over the next week or two.
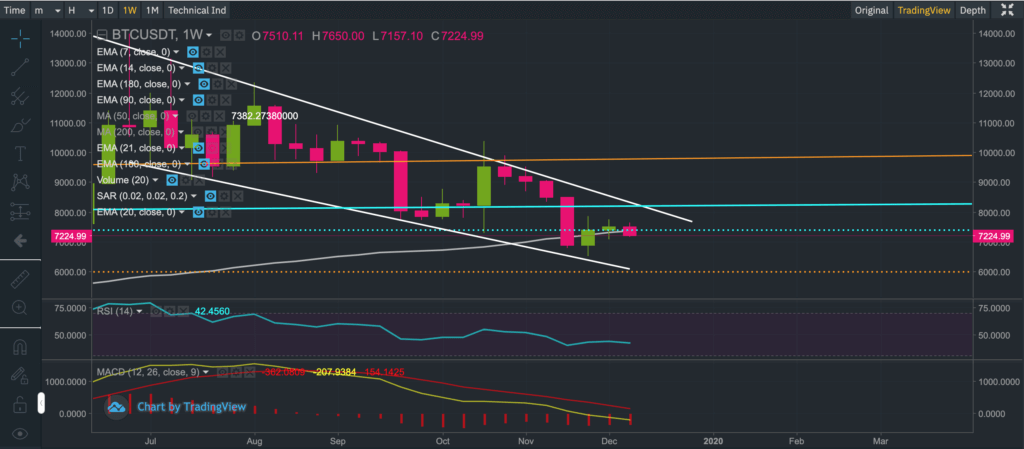
The weekly candlestick chart, above, shows the price of Bitcoin failing to gain any meaningful traction above $7,300 level and is ultimately in agreement with the conclusion drawn from the monthly chart.
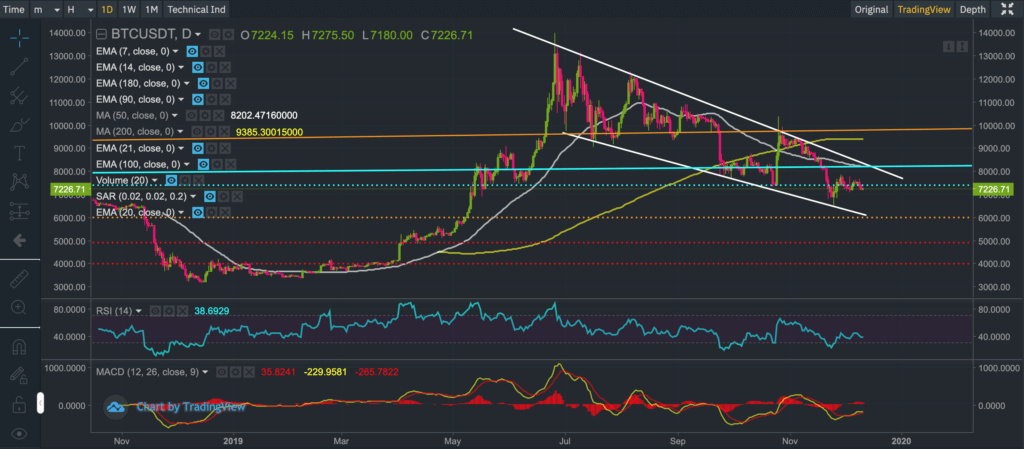
The daily chart, above, is also in agreement. Don’t try to overthink things at this juncture. Let the price trend play its own course.
As stated in our previous commentary, “We continue to see even sharper declines in the horizon although our research indicates Bitcoin could bottom somewhere between $6,000 and $5,000“.
This raises some questions over the risk/reward tradeoff of being trader versus HODLER at the moment. In other words a cost averaging approach, picking up small amounts of Bitcoin at lower price levels could prove worthy of consideration at this juncture.
As per our previous updates, we remind our audience that we do not have a crystal ball. We attempt to apply a combination of mathematics, fundamental and technical analysis to our updates to provide you with fresh and unique insights although at the end of the day there are no guarantees.
We reiterate that our derived price scenarios for Bitcoin may not pan out and therefore we warn our growing audience to tread very carefully and their own risk. Bitcoin is very risky (as you must all know by now) and past performance is not always indicative of the future.
If you enjoy reading our updates and analysis then start following us on Twitter.
The next Bitcoin update will be published on Monday 16th December.
Anyone interested in reading our previous updates may do so here as they remain valid and provide a good trail for anyone wanting to catch up.
If you’re thinking about trading bitcoin then visit our bitcoin price analysis page. Here we periodically provide interesting bitcoin price insights and analyses that every crypto trader and investor should be aware of.
