Flash Alert: Monday 27th January
What happened after our update on 20th January?
The price of BTCUSDT is up by a further $300 from $8,671-$8,679 last week to $8,974 at the time of writing today.
In our update last week we observed Bitcoin’s bearish tide receding, noting, at the time, that Bitcoin had been finding some good support at the 7-day EMA and the MACD crossovers on the weekly chart were beginning to show a bullish crossover.
On the flip side, we also cautioned that the price of Bitcoin had been encountering resistance at the 200-day moving average and noted that the RSI indicators were emitting an overbought signal, suggesting some selling pressure may ensue, which is precisely what happened in the days ahead.
The price of BTCUSDT caved through the 7-day EMA on 23rd January (three days after our update) followed by further selling pressure on 24th January, when BTCUSDT fell to an intra-day low of $8,238.
BTCUSDT has since recovered, with the price seen currently trading back above the 200-day EMA of $8,914 today following an earlier intra-day high of $9,000.
So where do we stand from here?
Based on the price action, we believe Bitcoin is entering the most bullish phase of a bull market megacycle that had initially began in April/May 2019.
We note that Bitcoin is (at the time of writing today) trading above the 200-day moving average, which is a very positive sign. This is clearly illustrated in the daily chart, below.
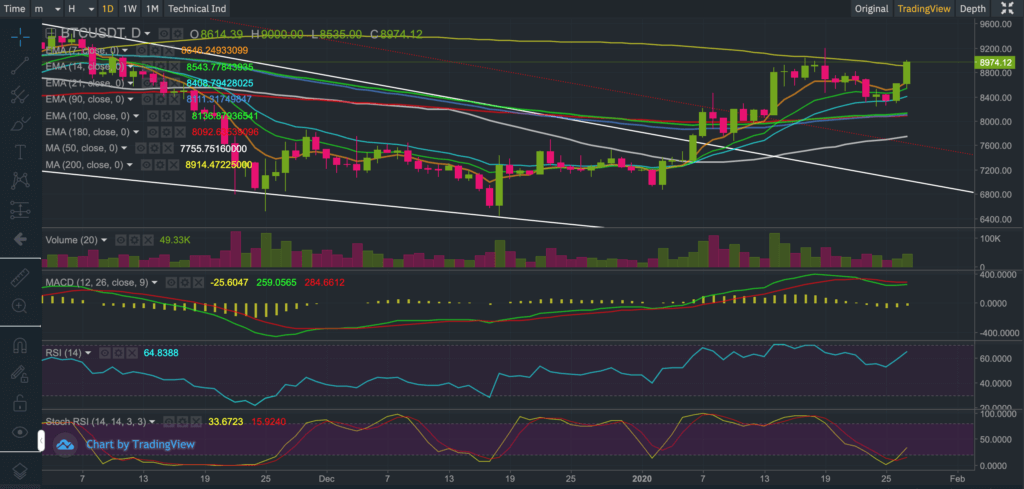
We do not discount the possibility of seeing some profit-taking take place over the next 24-48 hours and will be watching closely to see if BTCUSDT is capable of maintaining support at the 200-day moving average.
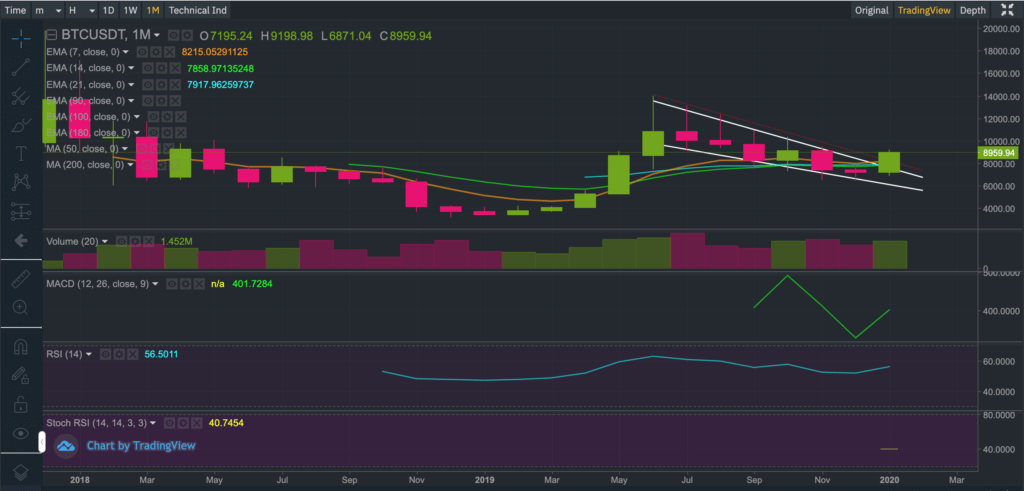
Furthermore, the monthly chart (below) shows the 6-month bearish descending channel clearly being violated on strong buying volumes. If Bitcoin manages to end the month at current price levels (or higher) it would confirm our bullish observations.
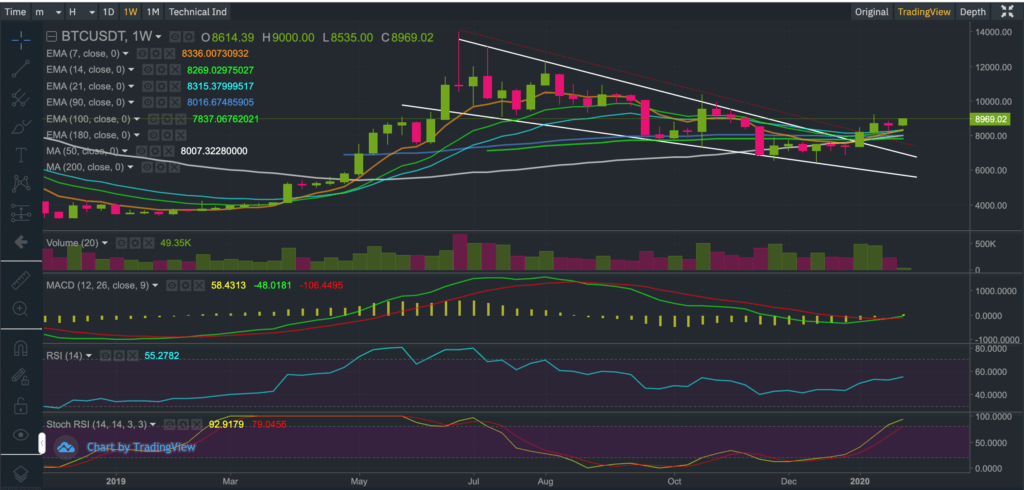
Furthermore, the weekly chart below clearly illustrates a bullish MACD crossover, implying the Bitcoin price trend may be gearing up for a strong rally towards the $10,000 region.
If the research we have conducted contains any validity – and so far there seems to be some evidence that it does – it could suggest Bitcoin is bottoming out. You may read a previous Bitcoin update that summarises the research we had conducted to arrive at these observations.
As per our previous updates, we reiterate to our audience that we do not have a crystal ball. We attempt to apply a combination of mathematics, fundamental and technical analysis to our updates to provide you with fresh and unique insights although at the end of the day there are no guarantees.
Our derived price scenarios for Bitcoin may not pan out and therefore we warn our growing audience to tread very carefully and at their own risk. Bitcoin is very risky (as you must all know by now) and past performance is not always indicative of the future.
If you enjoy reading our updates and analysis then start following us on Twitter.
The next Bitcoin update will be published on Monday 3rd February 2020
Anyone interested in reading our previous updates may do so here as they remain valid and provide a good trail for anyone wanting to catch up.
If you’re thinking about trading bitcoin then visit our bitcoin price analysis page. Here we periodically provide interesting bitcoin price insights and analyses that every crypto trader and investor should be aware of.
