Flash Alert: Monday 20th January
What happened after our update on 14th January?
Following our update on 14th January, the price of BTCUSDT rose by a further $500 from $8,700 to around $9,200 ($9,198.98 to be precise) before being knocked back to $8,671-$8,679 region at the time of writing today.
In our update last week we observed Bitcoin breaching a bearish descending channel resistance level across the daily, weekly and monthly charts, adding that Bitcoin appears to be bottoming out and very likely to test the $9,000 level, which it did!
The price action so far seems to justify the observations made in our log price research, where we had identified that Bitcoin is likely to be experiencing a ‘bearish consolidation phase within a bull market megacycle.
So where do we stand from here?
The bullish view
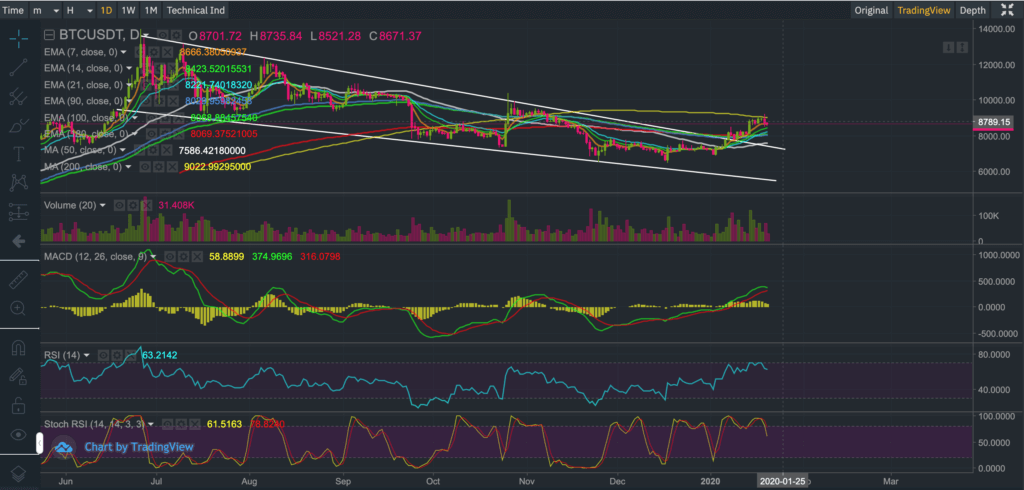
Bitcoin is currently finding very good support above the 7-day EMA of $8,666 suggesting bulls are still in charge.
But we are most excited to bring the weekly period MACD to your attention, which just broke into bullish grounds today, as may be seen from the chart below.
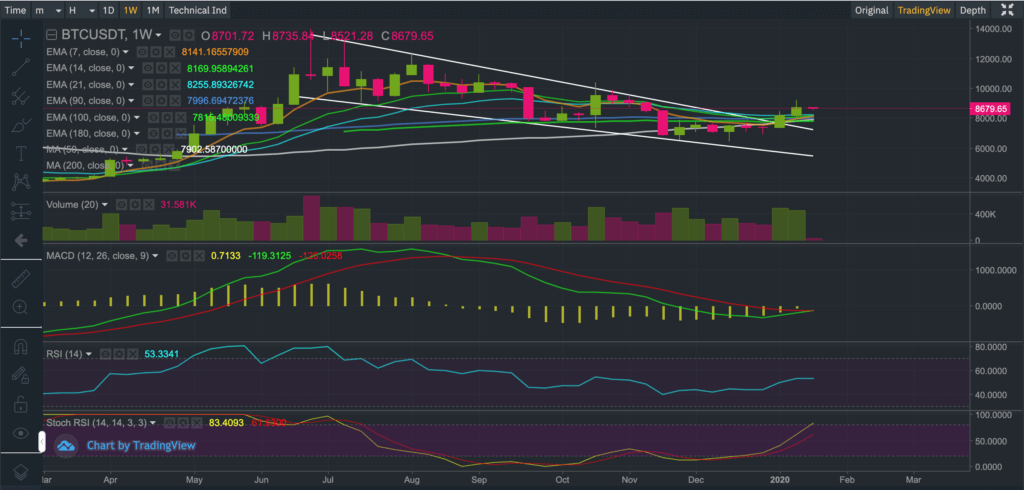
The MACD crossovers on the weekly chart have historically been reliable at confirming a change in the underlying tide, with the current crossover suggesting Bitcoin is moving into a powerful bullish phase.
But there are nearly always two sides to the coin, so what’s keeping Bitcoin back at this juncture?
The bearish view
From a price action perspective, it is apparent there is a major tug of war with the bears at the moment, with the price of Bitcoin seen knocked back on every occasion it rose above the 200-day moving average of $9,022 on the intra-day charts.
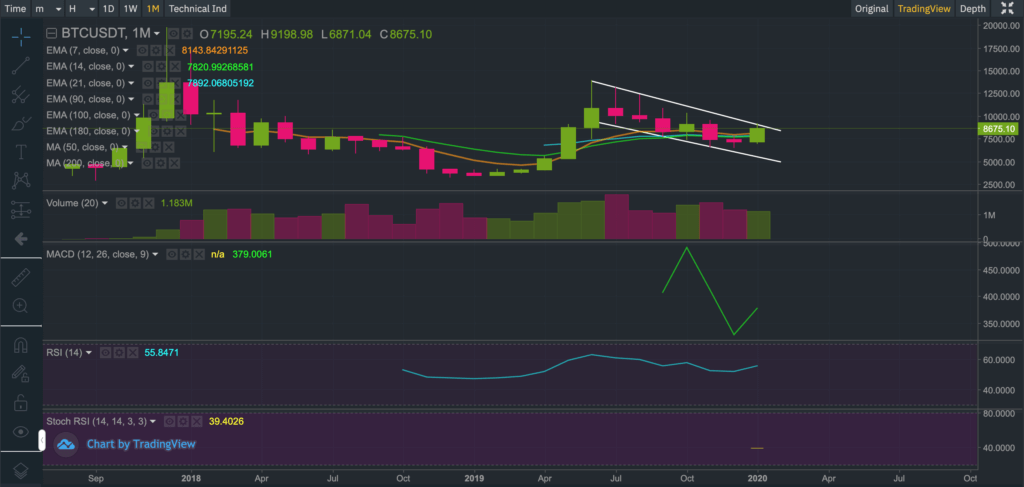
Failure to close above the 200-day moving average is seen as a sign of weakness and is likely causing some trepidation. After all the stochastic RSI is currently emitting an overbought signal and after re-angulating the monthly chart (to cross through the monthly peak price) we may see that Bitcoin is actually still stuck inside the bearish descending channel!
In order for us to gain further confidence in the changing tide, we would want to see:
1) the 200-day moving average beginning to act as support for BTCUSDT and
2) Bitcoin to close above $9,200 by end of the month.
So far today, BTCUSDT has reached an intra-day high of $8,735.84 and a low of $8,521.28.
If the research we have conducted contains any validity – and so far there seems to be some evidence that it does – it could suggest Bitcoin is bottoming out. You may read a previous Bitcoin update that summarises the research we had conducted to arrive at these observations.
As per our previous updates, we reiterate to our audience that we do not have a crystal ball. We attempt to apply a combination of mathematics, fundamental and technical analysis to our updates to provide you with fresh and unique insights although at the end of the day there are no guarantees.
Our derived price scenarios for Bitcoin may not pan out and therefore we warn our growing audience to tread very carefully and at their own risk. Bitcoin is very risky (as you must all know by now) and past performance is not always indicative of the future.
If you enjoy reading our updates and analysis then start following us on Twitter.
The next Bitcoin update will be published on Monday 27th January 2020
Anyone interested in reading our previous updates may do so here as they remain valid and provide a good trail for anyone wanting to catch up.
If you’re thinking about trading bitcoin then visit our bitcoin price analysis page. Here we periodically provide interesting bitcoin price insights and analyses that every crypto trader and investor should be aware of.
