Flash Alert: Monday 16th December
Bitcoin has traded mostly sideways over the last three weeks, with support seen mostly around the $7,000 level. However, at around 18:26 UTC today, which coincides with the time we started our analysis, the price of Bitcoin had started to dip, reaching an intra-day low of $6,850.
By 18:55 UTC, the price of Bitcoin had recovered somewhat to around $6,900 but by 20:50 UTC it was back below $6,860.
The latest price action confirms to us that the overall bias remains skewed to the downside – just as we have been pointing out.
The price action we have witnessed lately has been mostly feeble with very little support seen on each occasion there was a bounce. And currently, we are seeing some convergence between the RSI and MACD indicators, as seen on the chart above, with both indicators suggesting the level of bearishness is likely to accelerate.
Based on our observations, we continue to expect the price of Bitcoin to drift lower and to retest the November lows of around $6,500 imminently.
But our own research suggests Bitcoin is fast approaching a potential bottom.
Hash rate research could suggest a potential bottom of $5,700- $7,100
If you look at the Bitcoin hash rate, it is currently falling!
The chart below is sourced from blockchain.com and suggests the current hash rate has fallen from a high of 110M to 79M.
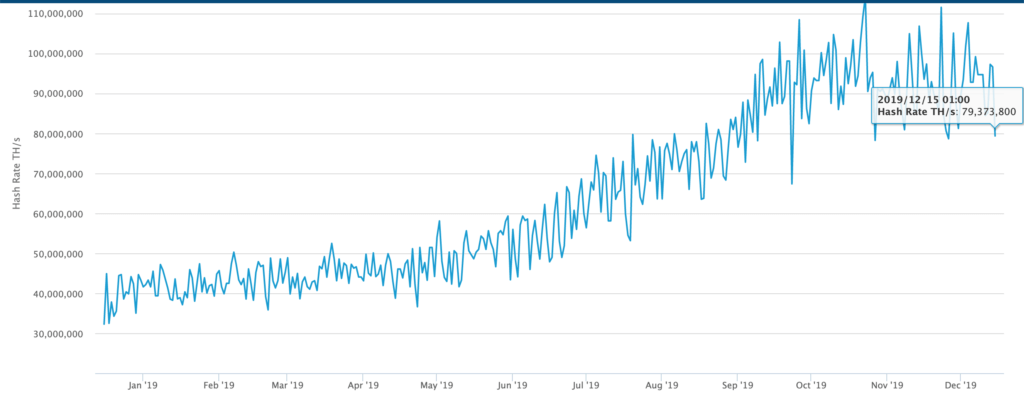
From an operational perspective, a drop in the hash rate means the Bitcoin network is becoming increasingly weaker.
But what does this mean from a valuation perspective you may ask?
If the Bitcoin hash rate reverts back to a historical level of 40M – 50M, as seen from the chart above, that could imply a Bitcoin price valuation of $5,700 – $7,100 per BTC – that’s based on a mathematical model derived from our proprietary fundamental research.
Log Price Analysis suggests a potential bottom of $6,000 – $5,000
If we look at separate proprietary research on the Bitcoin log price, it suggests a potential bottom could reside somewhere between $6,000 and $5,000 per BTC.
In the greater scheme of things, nobody has a crystal ball to know precisely where Bitcoin is going to fall to. There are no guarantees. However, if the research we conducted contains any validity, it could suggest Bitcoin isn’t too far away from a potential bottom.
This raises some questions over the risk/reward tradeoff of being trader versus being a HODLER. In other words, a cost averaging approach, picking up small amounts of Bitcoin on the dips, could prove worthy of consideration at this juncture.
As per our previous updates, we reiterate to our audience that we do not have a crystal ball. We attempt to apply a combination of mathematics, fundamental and technical analysis to our updates to provide you with fresh and unique insights although at the end of the day there are no guarantees.
Our derived price scenarios for Bitcoin may not pan out and therefore we warn our growing audience to tread very carefully and their own risk. Bitcoin is very risky (as you must all know by now) and past performance is not always indicative of the future.
If you enjoy reading our updates and analysis then start following us on Twitter.
The next Bitcoin update will be published on Monday 30th December.
Anyone interested in reading our previous updates may do so here as they remain valid and provide a good trail for anyone wanting to catch up.
If you’re thinking about trading bitcoin then visit our bitcoin price analysis page. Here we periodically provide interesting bitcoin price insights and analyses that every crypto trader and investor should be aware of.
