Flash Alert: Tuesday 15th October
Bitcoin attempted to make a run past $8,400 during the Asian trading session earlier today in a desperate attempt to establish a reversal only to be met with a blow that saw the price knocked all the way back to $8,300 again!
And even at the $8,300 level, Bitcoin is seen struggling. This adds to the bearish mood, which in turn risks dragging the price further south throughout the day.
The bullish case for Bitcoin
Our analysts have become split on the overall price trajectory of Bitcoin following a recent research report analysing the log price chart of Bitcoin, which may be read here,
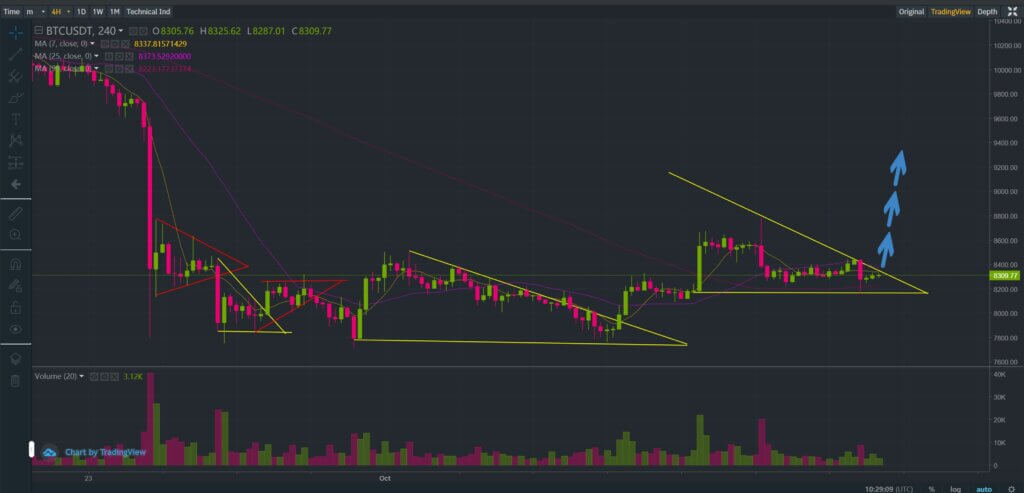
And on the 4-hour chart it is also possible to see the price of Bitcoin trading within what seems to be a descending wedge formation; a pattern that has been mostly bullish.
We also had an open discussion about this pattern yesterday, which you may want to view and continue to contribute here.
And in the meantime, we take this opportunity to thank those who have already contributed with their views.
The bearish case for Bitcoin
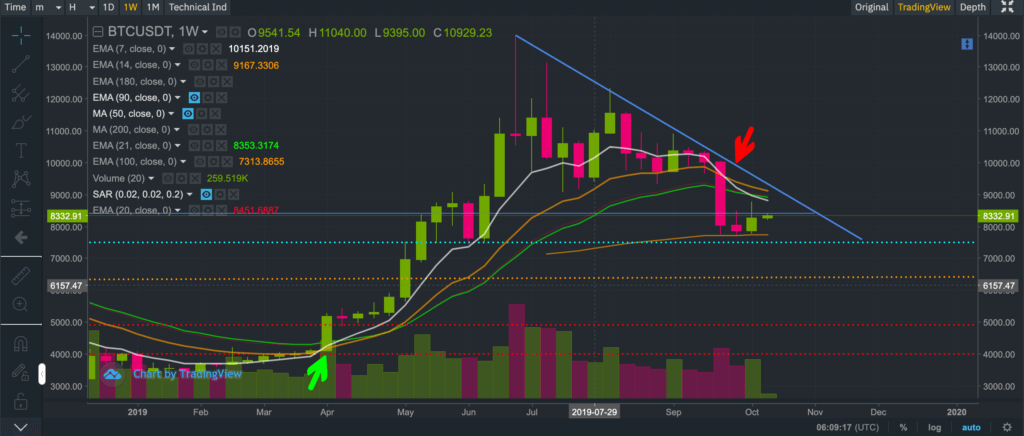
Experience has taught us to not ignore moving average crossovers, especially on weekly or monthly charts.
If we look at the weekly chart, we can see the 7-weekly EMA having crossed through the 14-weekly EMA from the top.
And recently, the 7-weekly EMA has crossed through the 21-weekly EMA from above.
Historically, these crossovers have been very accurate at denoting the beginning and the end of bullish trends (as per green and red crosses on the chart).
So what’s going on?
Research is bullish on Bitcoin
In the greater scheme of things our inhouse research seems to be suggesting that Bitcoin is undervalued and that it could be in fact at the beginning of an explosive bull market cycle.
We hypothesize there may be an incentive for those miners who have invested heavily in new equipment to intentionally exert pressure on the price of Bitcoin.
The rational here is that by lowering the price of Bitcoin those miners would wipe out slower competing miners that are contributing to the rising difficulty rate of mining new blocks. And that this ‘survival of the fittest’ scenario would help the fastest miners achieve the maximum number of Bitcoins they can possibly acquire before the next halving in May 2020.
So we are searching for any strong signs of bottoming out
We are attempting to see whether there are any signs of this seemingly bearish trend or bullish consolidation phase bottoming out.
Currently, we are looking at the monthly charts to see if the 7-month EMA of $8,286 will hold, although so far today we remain unconvinced it will.
A close below $8,286 will likely see the price descend to around $8,200 – $8,000 and quite possibly the 14 and 21-monthly EMAs, which currently reside at $7,708 and $7,846 respectively.
$7,710 has acted as a strong support recently so if Bitcoin reaches this level again we will be watching volumes closely to see whether it is able to attract any meaningful support again.
We have our own internal consensus target of $7,500 and our research suggests that anything below that level really starts to dampen the bullish mood.
Our recent report simulated whether $6,500 could be a possible bottom for Bitcoin although based on our log price chart analysis that level appeared to deviate too far away from historical bullish patterns, especially if maintained for a prolonged period.
However, a closer and more thorough mathematical investigation is warranted.
So based on the research, we are currently expecting Bitcoin to find a bottom somewhere between $7,800 – $7,500.
Perhaps its a matter of Bitcoin trading sideways for a while longer before we can see any strong evidence of bottom forming?
The price of BTCUSDT has been range bound between $8,350 and $8,195 on the 4-hour charts. And if we go back further, we can see BTCUSDT stuck in a wider trading channel of $8,779 and $7,710.
But no matter how compelling certain research may be, always exercise caution and never deviate away from sound risk management principles.
The issue with most research in general is that observations are derived using historical data and there nearly always a natural tendency to assume that certain historical patterns will repeat themselves. But trends do eventually break down over time, so be cautious.
At the time of writing today, BTCUSDT was trading $8,332.91 following an earlier intra-day high of $8,403 and low of $8,286.
A follow up post to this Flash Alert is available here.
If you enjoy reading our updates and analysis then start following us on Twitter now join our new Reddit Community.
Become a member now to stay up to date with our latest flash alerts. research posts and educational guides.
In the meantime, anyone interested in reading our previous Flash Alerts may do so here as they remain valid and provide a good trail for anyone wanting to catch up with recent price action.
If you’re thinking about trading bitcoin then visit our bitcoin price analysis page. Here we periodically provide interesting bitcoin price insights and analyses that every crypto trader and investor should be aware of.
