Flash Alert: Wednesday 16th October
The price action we are seeing lately has led us to revise our bearish price target range from $7,800-$7,500 to a lower yet wider range of $5,000 – $6,000. And we provide a mathematical justification for this, below.
But first, let’s discuss the price action over the last 24 hours.
Yesterday we saw the price of BTCUSDT trading at $8,250 at around 15:55 UTC before spiking to $8,360 only minutes later in a desperate attempt to shrug off bearish sentiment.
However, selling pressure emerged almost immediately at the $8,360 level, instantly knocking BTCUSDT down to a new intra-day low of $8,090.
The price action seen yesterday has left the market with a sour taste today, with Bitcoin seen attempting to break through $8,180 on multiple occasions over the last 24 hours to no avail.
At the time of writing today, BTCUSDT was trading at $8,168 following an earlier intra-day high of $8,181 and low of $8,144.
If we look the facts so far (in no particular order) this is what we see:
1. Bitcoin has been trending lower ever since the peak in Q2 of this year. We have seen this trend being called a bull market trap and in our recent research post we even tried make a case for it being a bullish consolidation within a bull market mega cycle.
Whatever it is, we can’t go wrong by simply calling it a bearish trend.
And this bearish trend is making all the right noises for a proper bear market selloff.
2. Bitcoin has had plenty of opportunities recently to regain a footing over the critical 200-day moving average. But we all know how those failed attempts have fared.
3. Moving averages on the daily, weekly and monthly charts are exhibiting bearish crossing overs, as pointed out in our update yesterday.
4. And now, we can see an overarching bearish triangle and bear flag formation staring straight into our face.
5. These are really powerful bearish trends that just don’t dissipate overnight.
WE believe a more powerful bearish trend has to play out, and the faster it does, the better it will be for those of us who are expecting the price of Bitcoin to rally to new record highs after the halving in May 2020.
So where is Bitcoin likely to be heading next?
It certainly doesn’t appear to be heading to the moon anytime soon.
Our internal consensus has been bearish on the overall price trajectory for some time now with a target of $7,500.
And in our previous post we had mentioned that our recent research suggests that anything below the $7,500 level really starts to dampen the mood for those of us who believe that Bitcoin is in a bullish consolidation phase.
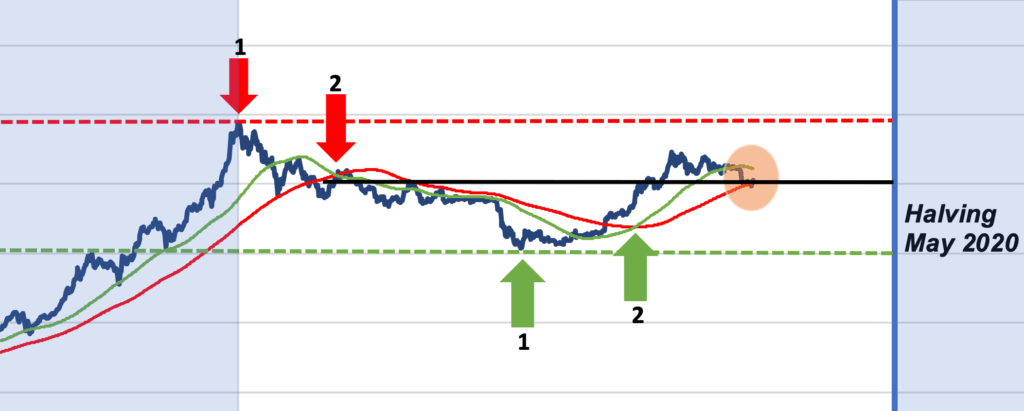
The report had shown some compelling historical trends repeating themselves, with Bitcoin historically seen moving into a bullish mega cycle 9-12 months before previous halvings.
And just like clock work, there was a re manifestation of that trend in Q1 of this year. That is also clearly visible in our log price chart analysis, see below (bullish crossover, green arrow 2).
If we try to make sense of what has happened, the likelihood is that we have fallen into a confirmation bias trap.
Many traders and investors saw the bullish pattern repeating itself exactly one year before the halving, leading market participants to jump onto the bandwagon and resulting in the price of Bitcoin to overshoot between March and June of this year.
So what happens after an overshooting period?
The result is a sharp price correction, which doesn’t appear like your typical friendly bullish consolidation at all!
Below is a bearish scenario using the raw data from our log price chart analysis.
If we apply the precision of mathematics, we obtain a better idea where the price of Bitcoin may settle based on historical overshootings (of a similar magnitude as seen recently).
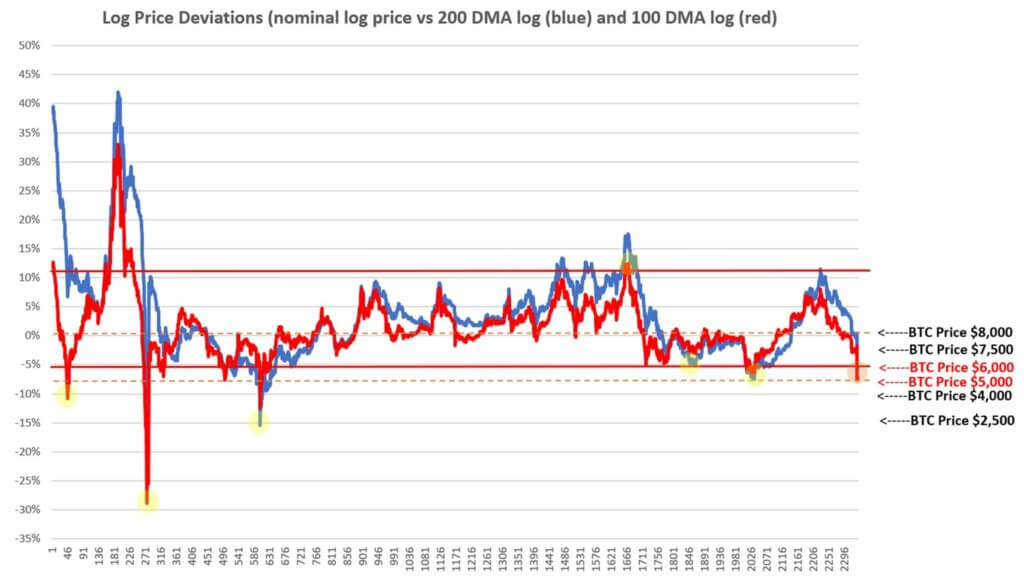
And based on historical patterns repeating themselves, the math suggests that if 8,000 does not hold, Bitcoin will very likely find a bottom somewhere in the region of $5,000 – $6,000.
Put another way, if $8,000 doesn’t hold, we will start looking for evidence of a bottom initially at $6,000 and then at $5,000 (if $6,000 fails to hold up).
The chart (above) speaks volumes in our opinion.
And by measuring the bearish triangle below, $6,000 appears reasonable.
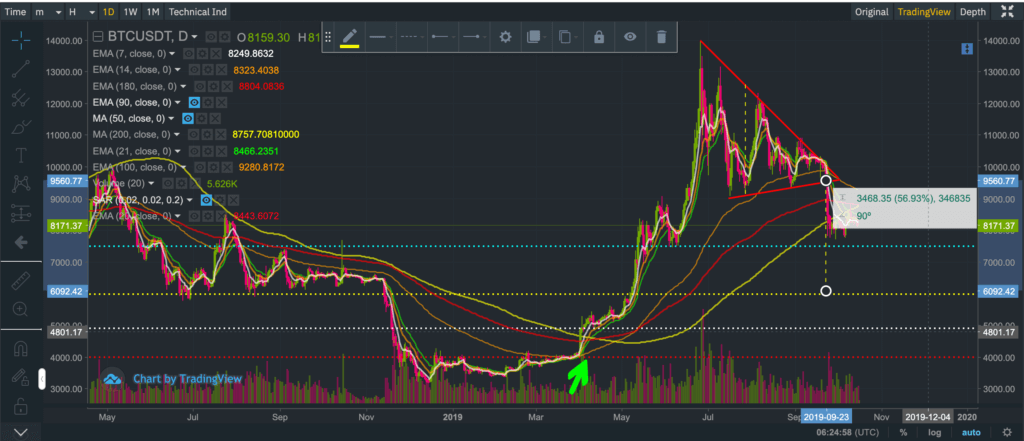
Depending on how you interpret this bearish triangle, $5,300 also looks like a possibility.
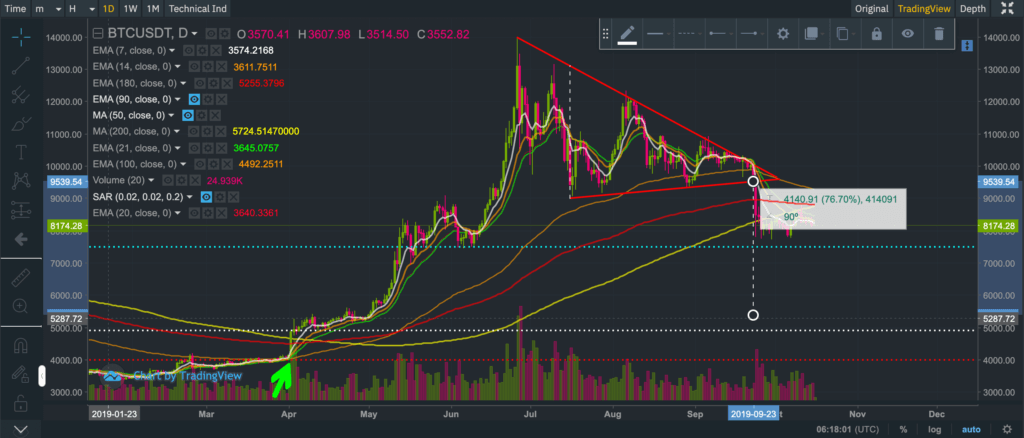
What this analysis does for us at least is provide a mathematical justification that adds weight to a bottom forming between $5,000 and $6,000. And that discounts the more bearish scenarios – at least for the time being.
Of course we do not have crystal ball (and nor does anybody else we know have one for the matter). Historical performance is not indicative of future performance and trends do eventually break down.
Therefore, never deviate away from sound risk management principles and never ever trade or invest more than you can afford to comfortably lose.
If you enjoy reading our updates and analysis then start following us on Twitter now join our new Reddit Community.
A follow up to this Flash Alert may be found here.
In the meantime, anyone interested in reading our previous Flash Alerts may do so here as they remain valid and provide a good trail for anyone wanting to catch up with recent price action.
If you’re thinking about trading bitcoin then visit our bitcoin price analysis page. Here we periodically provide interesting bitcoin price insights and analyses that every crypto trader and investor should be aware of.
