Flash Alert: Tuesday 14th January
What happened after our update on 6th January?
Following our update on 6th January, the price of BTCUSDT rallied by $1,150 from $7,551 to $8,700 at the time of writing today.
In our update last week we accurately pointed out a number of bullish points for Bitcoin and had observed that BTCUSDT was showing signs of a bottom with both price flows and price trends seemingly beginning to pick up.
At the time we had noted that Bitcoin was trading very close to a channel resistance level that persistently held strong since June 2019 (6 months). However, we had also noticed renewed selling pressure re-emerging around the $7,600 level on the intra-day charts.
We had noted that incremental selling pressures ( at around the $7,600 level) could prevent Bitcoin from breaching the 6-month resistance channel although at the same time did not discount the possibility of seeing Bitcoin breach resistance at a later stage and therefore mentioned that we would be on standby.
Since our previous update Bitcoin has powered to a new plateau and has now clearly breached the channel resistance lines across the daily, weekly, and monthly charts.
The breaking of the bearish channel seems to confirm our view that Bitcoin has been experiencing a ‘bearish consolidation phase within a bull market megacycle.
And we also remind our audience that the bullish trends that we are currently experiencing right now were noted as far back as October. You may read that report here.
The trends we are seeing at this juncture lends its merits to our research capability.
So, where do we stand from here?
For starters, let’s revisit the bearish resistance channel on the monthly, weekly and daily charts to see if they all tally up.
Monthly charts
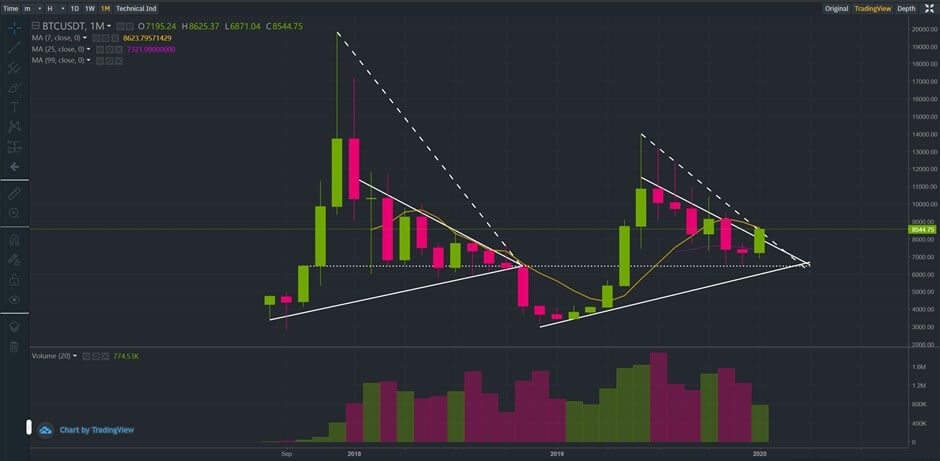
At the time of writing, Bitcoin had broken the bearish channel resistance on the monthly chart with the 7-monthly moving average of $8,600 seen as a critical level for BTCUSDT to surpass. This means we would want to see BTCUSDT close above $8,600 for the current pick up in Bitcoin to remain intact.
Weekly charts
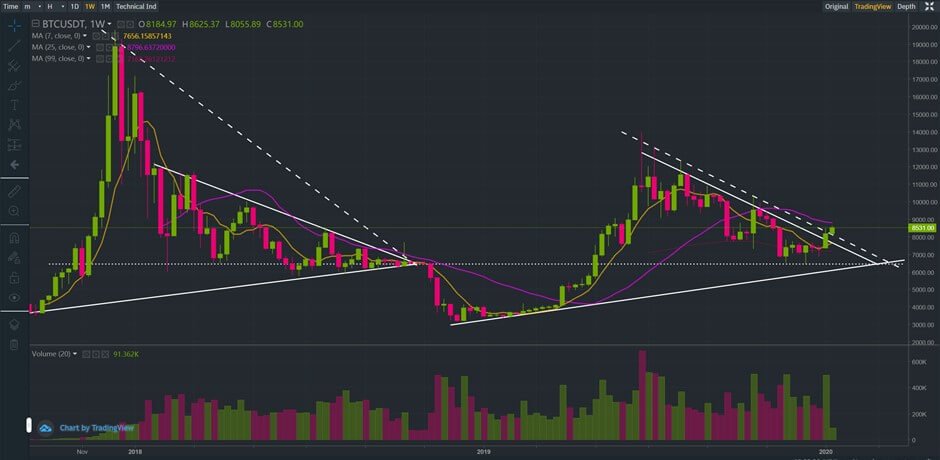
On the weekly charts, we may see the bearish channel resistance breach even more clearly although observe the 25-weekly moving average of $8,800 acting as a resistance barrier for BTCUSDT. This means we would want to see BTCUSDT close above $8,800 for the current pick up in Bitcoin to remain intact.
On a separate note, it is also very exciting to see the weekly period MACD turning bullish and on the verge of a bullish crossover – and when that happens, the underlying tide is expected to increasingly become bullish!
Daily Charts
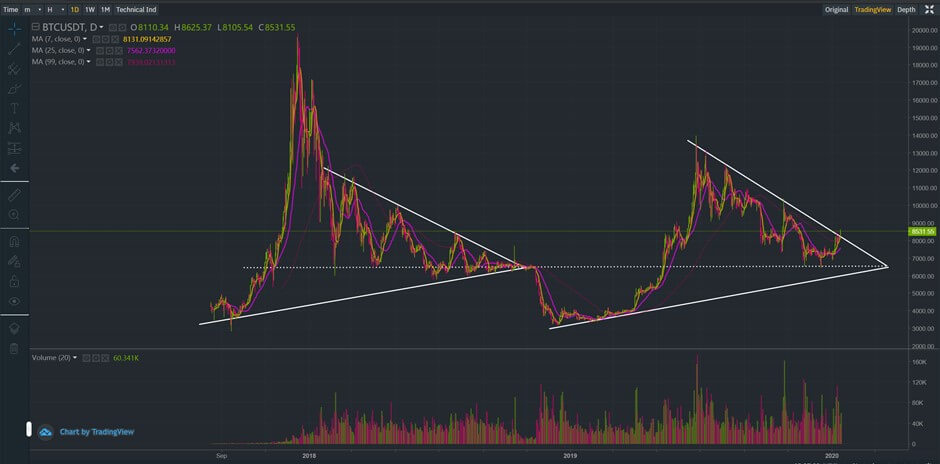
The daily chart also shows a clear breach of a triangle resistance line while the chart below shows Bitcoin breaking outside of a bearish descending channel.
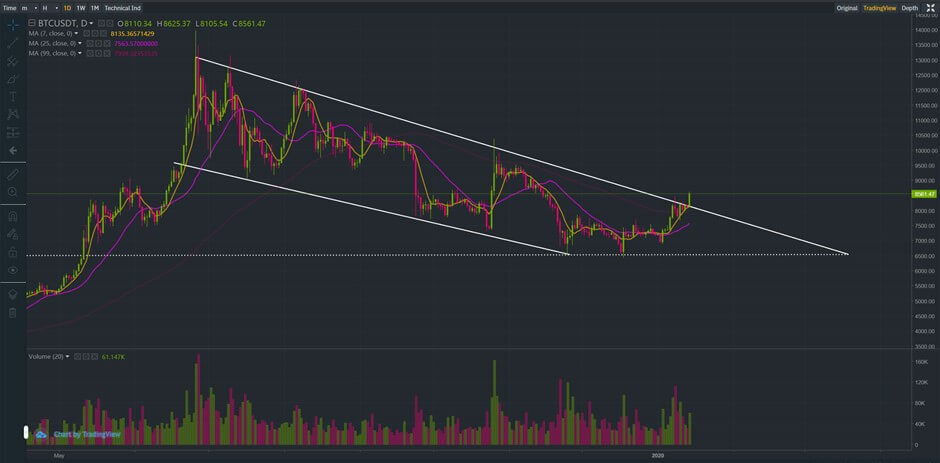
We note Bitcoin has to close above $8,600 for the bulls to remain cheerful over the short term, although with the MACD on the daily charts showing positive momentum, this scenario seems likely. On the other hand, the 14-day RSI and stochastic RSI both appear somewhat overbought at this juncture so we cannot discount a sharp pullback either.
So far today, BTCUSDT has reached an intra-day high of $8,775 and a low of $8,105. Should BTCUSDT breach its earlier high sometime later today then we expect Bitcoin to test $9,000, a level that coincides with the 200-day simple moving average.
If the research we have conducted contains any validity – and so far there seems to be some evidence that it does – it could suggest Bitcoin is bottoming out. You may read a previous Bitcoin update that summarises the research we had conducted to arrive at these observations.
As per our previous updates, we reiterate to our audience that we do not have a crystal ball. We attempt to apply a combination of mathematics, fundamental and technical analysis to our updates to provide you with fresh and unique insights although at the end of the day there are no guarantees.
Our derived price scenarios for Bitcoin may not pan out and therefore we warn our growing audience to tread very carefully and at their own risk. Bitcoin is very risky (as you must all know by now) and past performance is not always indicative of the future.
If you enjoy reading our updates and analysis then start following us on Twitter now join our new Reddit Community.
The next Bitcoin update will be published on Monday 20th January 2020
Anyone interested in reading our previous updates may do so here as they remain valid and provide a good trail for anyone wanting to catch up.
Develop your understanding of trading with our free educational guide that walks you through the five rules you need to master before trading crypto.
