Flash Alert: Monday 9th September
We were hoping to see Bitcoin retest Friday’s highs of $10,905.87 over the weekend and to close above the $11,000 level to confirm the continuation of the bullish trend that had begun toward the end of Q1 of this year.
However, multiple rejections at the upper resistance level of the descending wedge formation consequently knocked BTCUSDT all the way back to around the $10,400 level – an area where it currently appears to have somewhat stabilised.
We note nevertheless that we have been seeing renewed selling pressure come back to haunt BTCUSDT whenever it approaches the $10,590 level.
On Saturday, BTCUSDT traded within a range of approx $300, reaching a high of $10,588 and a low of $10,288.57. Then on Sunday, it traded within a range of approx $385, hitting a high of $10,592.5 and a low of $10,208.
So far today, BTCUSDT has traded in a wider range of approx $412, hitting a high of $10,480 and a low of $10,068.5. At the time of writing BTCUSDT was trading at $10,333.
We note that between Saturday and today, the intra-day price range has widened and the price has hit lower lows.
Last week bulls were encouraged to see the price of BTCUSDT supported above short-term moving averages, although the situation appears to have turned yet again, and now resistance is beginning to show up around the same short-term moving averages that were previously providing support.
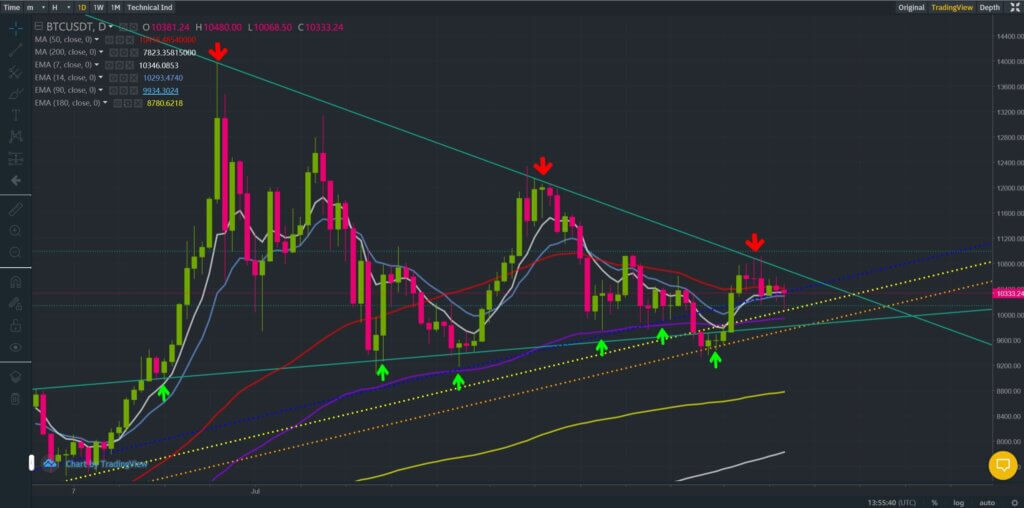
At the time of writing, BTCUSDT was trading below its 7-day simple moving average (for a second day) and below its 50-day moving average.
If BTCUSDT closes below its 7-day exponential moving average (currently @ $10,340) then we may see further consolidation to around the $9,800 level. We note the 7-day exponential moving average is a level that also coincides with the (blue dotted) bullish trend line, which has served as a springboard for multiple bullish moves since Q1 of this year.
So where to next?
Hard to say since BTC is very peculiar animal. We were early in recognising that the Stochastic RSI was ‘overbought’ on our Friday post, and had indicated that some profit taking may ensue, which is what has been happening.
RSI’s are beginning to appear ‘overbought’ whilst at the same time we note the price is touching the upper the Bollinger band on the daily charts, which usually suggests that some selling pressure may ensue – although certain traders may perceive any weakness to be temporary and quite possibly an exciting entry point opportunity for themselves.
Source: CoinMarketExpert Flash Alert: Friday 6th September
So whilst some bullish wind has been knocked out of BTC, we note that the overall trend still remains firmly bullish although at the same time we acknowledge that momentum has dipped a little more abrupt than anticipated (although that’s BTC for you) and it is currently leaving the market feel a little on edge.
A follow up post to this Flash Alert may be found here.
If you’re thinking about trading bitcoin then visit our bitcoin price analysis page. Here we periodically provide interesting bitcoin price insights and analyses that every crypto trader and investor should be aware of.
