Flash Alert: Monday 21st October
The price of Bitcoin is more or less unchanged from the level seen in our previous update on 16th October.
During the interim period we have seen the price of BTCUSDT initially drift lower, reaching an intra-day low of $7,816 on Sunday, before powering to an intra-day high of $8,115 as the bulls took over the reins.
And at the time of writing today, BTCUSDT was back above $8,200 (a level seen during our previous update) at precisely $8,235.38 following an earlier intra-day low of $8,183 and high of $8,251.41.
Has the price of Bitcoin really found a bottom?
Consistent support at the $7,700-$7,800 levels
The latest move is encouraging for Bitcoin as it suggests there is a willingness for buyers to re-emerge and support the price between $7,700-$7,800.
And many market participants are claiming that consistent support at those levels is a harbinger of further bullish momentum.
We have seen many even claiming this is confirmation of a bottom, and calling for the price of Bitcoin to garner further bullish traction in the run up to the May 2020 halving date.
For those who are interested, you may want to read more about Bitcoin’s historical price performance during the previous two halving events here.
Tightening supply, as miners sell less Bitcoin to artificially support the price
There have been suggestions in the media that at current price levels miners are intentionally selling less Bitcoin (to cover operating costs) in an attempt to help revive the market price and in turn raise profitability.
Since a Bitcoin mining operation is plagued with high expenses, miners are typically incenivised to sell a proportion of the Bitcoin they receive from the block reward in order to cover running costs.
We do not have the precise break-even figures for Bitcoin miners although we have seen $8,000 documented as well as lower figures ranging between $6,900 – $7,350.
So temporarily holding back from selling Bitcoin (whilst many investors accumulate and HODL) could be resulting in tighter supply conditions that is ultimately helping to support a higher price.
But we caution you to watch out because these conditions, if accurate, are not sustainable.
And we also have to consider that miners may be lending a proportion of their Bitcoin war chest to various crypto exchanges (that have introduced shorting/ margin trading) in return for attractive interest rates.
The break even figures we have seen do not factor in any interest miners may be earning on their idle Bitcoin. Therefore, if we account for this, it is very likely the break-even price level is much lower than $6,900, especially for those large institutional miners that are heavily invested in the most efficient mining equipment.
This means there may be scope for the price of Bitcoin to fall to even lower levels.
And as mentioned in previous reports, there may be a powerful incentive for the fittest miners to significantly weaken the price of Bitcoin to intentionally wipe out slower competing miners that are contributing to the rising difficulty rate of mining new blocks.
We hypothesis that in this scenario, the fittest miners would be able to maximise the number of Bitcoins they can accumulate before the halving in May 2020 (and in so doing maximise their long-term ROI).
What will it take for us to start becoming bullish on the price of Bitcoin?
It is entirely possible for the price of Bitcoin to bounce higher towards the upper channel resistance level (white line) which resides between the 180 EMA (red line) currently at $8,763 and the 200 SMA (yellow line) of $8,844.
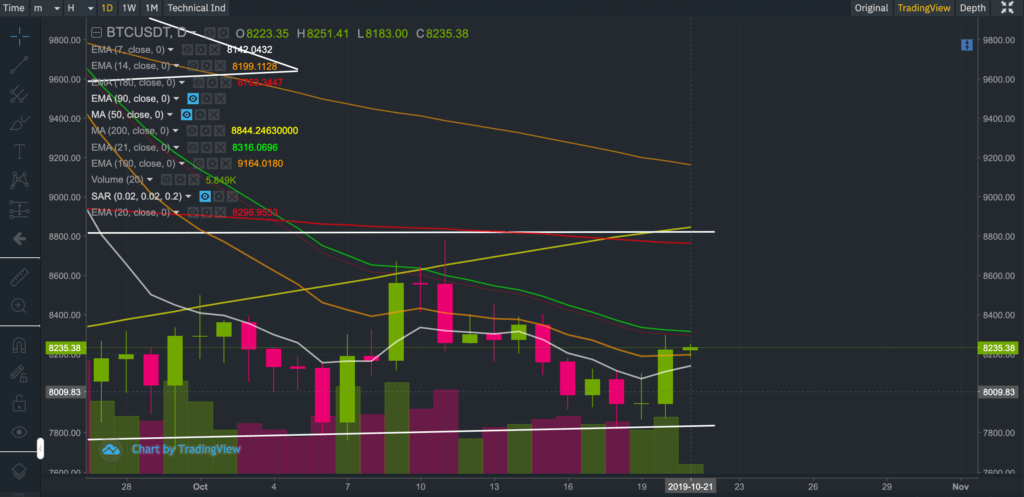
But until the price of Bitcoin manages to breach the 200-day moving average and until there is a strong evidence of support at that critical level, we will not even consider changing our bearish outlook on Bitcoin.
And that contrasts with our research, which actually suggests Bitcoin could be significantly undervalued.
It is not because we do not believe in our own research, its because you cannot purely trade on fundamentals or expect the exact repetition of the past to unfold.
Price and value deviate over time and may remain misaligned for a long period before re-converging.
And experience has taught us that price trends and moving average crossovers should never be ignored even though they are lagging indicators.
So to reiterate, the first thing that needs to happen for us to start changing our mind is for the price of Bitcoin to breach the 200-day moving average, and find support at that level.
A run to $9,500 would help to confirm to us that the bearish tide seen since Q2 of this year is really beginning to recede.
Boring is Best
If you are a HODLER and have a very long term horizon, price fluctuations should not really matter to you.
Nobody has a crystal ball. And for those of you who are tempted to buy Bitcoin, always apply sound risk management principles. Never invest more than you can afford to lose.
Those who do not care about the daily price fluctuations of Bitcoin typically apply a dollar cost averaging strategy, accumulating small amounts of bitcoin in a staggered manner over time. Whatever it is you want to do, this “boring is best” strategy has performed fairly well for the S&P 500 index over the last decade (and for Bitcoin too).
But remember Bitcoin is a totally different animal than the S&P 500 index. And needless to say, this is not financial advice and past performance is not indicative of future performance, so tread very carefully and at your own risk when considering to invest in Bitcoin or other cryptocurrencies.
Our conviction remains bearish
We do not discount the price of Bitcoin rising further in the short term. Nonetheless, we remain bearish and believe it is too premature to call it a bottom.
We will be watching carefully to see how BTCUSDT behaves if the price rises to the 200-day moving average, which currently resides around $8,844.
But we also point out there are many hurdles to clear before Bitcoin manages to reach the 200-day SMA. We also point out that the 180-day EMA has recently crossed through the 200-day SMA from above, which is of course a bearish sign.
We maintain our bearish conviction on the overall price trajectory of Bitcoin, with a current price target of $6,000 and the possibility of a further slide to $5,000 if the latter fails to provide adequate support.
Nobody has a crystal ball. Tread carefully and at your own risk. If anything, we hope our report helps you think a little more carefully about your risk exposures.
If you want to stay up to date with our latest posts then join our brand new Reddit Community and start following us on Twitter.
A follow up to this Flash Alert may be found here.
In the meantime, anyone interested in reading our previous Flash Alerts may do so here as they remain valid and provide a good trail for anyone wanting to catch up with recent price action.
If you’re thinking about trading bitcoin then visit our bitcoin price analysis page. Here we periodically provide interesting bitcoin price insights and analyses that every crypto trader and investor should be aware of.
