Disclaimer: All of the content written on CoinMarketExpert is unbiased and based on objective analysis. The information provided on this page should not be construed as an endorsement of cryptocurrency, a service provider or offering and should neither be considered a solicitation to buy or trade cryptocurrency. Cryptocurrencies carry substantial risk and are not suitable for everyone. No representation or warranty is given as to the accuracy or completeness of this information and consequently, any person acting on it does so entirely at their own risk. See further disclaimer at the bottom of the page.
Bitcoin Price Analysis: Monday 18th May 2020
What happened after our Bitcoin update on 12th May?
At the time of writing today, the price of BTCUSDT was trading at approximately $9,635, down from an earlier intraday high of $9,950.
Since our previous commentary, the price of BTCUSDT is up by around 9.5%. Since then we saw the price of BTCUSDT trade between $9,150 and $9,940 on some decent buy volumes.
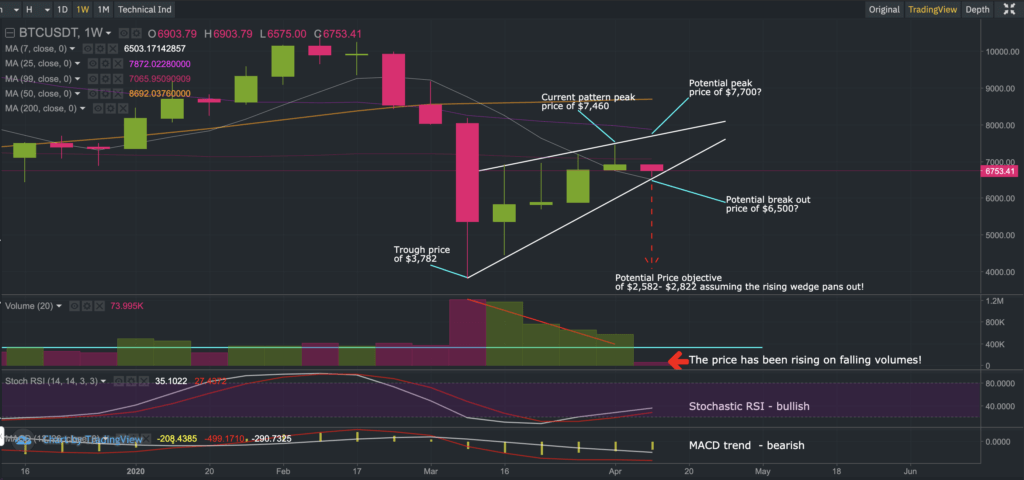
In our previous commentary, we had indicated that the bullish price trend was likely to continue, noting that the MACD on the weekly charts has been generally a good momentum indicator for Bitcoin and the bullish crossover suggests sentiment and price may continue to recover to higher grounds.
So where do we stand from here?
The trend is your friend
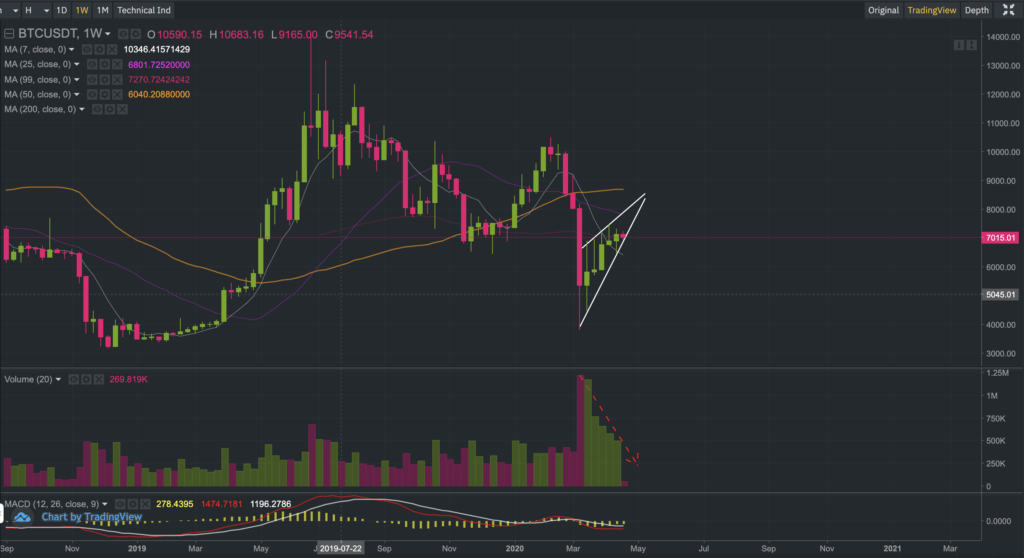
The current price trend remains on a bullish trajectory. This is reinforced by the weekly Moving Average Convergence Divergence Indicator (MACD). We also note that BTCUSDT has breached through a year-long descending downtrend (red dotted line) and remind our readers that a golden cross is just 3-5 days away from forming on the daily charts (all else equal).
A golden cross occurs when the 50-day simple moving average crosses through the 200-day simple moving average from beneath. This is typically considered to be a harbinger of further bullish price momentum.
14-day relative strength Indicators nearing overbought levels
Despite the bullish price trajectory, we also note that sellers have been known to emerge around the $10,000 level (give or take a standard deviation or two). Furthermore, relative strength indicators are nearing overbought levels.
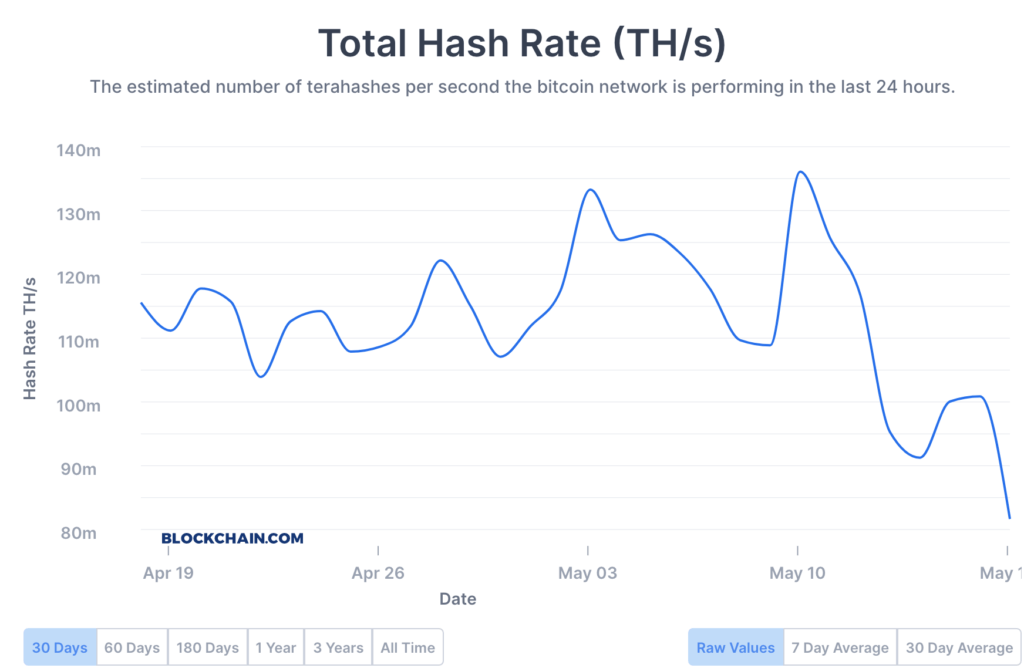
Falling hash rate
It is also very interesting to point out that the hash rate has been tanking over the last couple of days so this is something definitely worth keeping an eye on over the coming days to understand whether a reversal or steeper pullback is forthcoming.
The above points may help to explain why there is some trepidation weighing on Bitcoin at the moment. Whilst anything is possible, we note that any short-term profit-taking could act as a springboard that thrusts Bitcoin into the $11,000 region.
As per our previous commentary, we continue to maintain that the biggest challenge for Bitcoin at this juncture resides at the $11,500 level (if it reaches that level, of course).
We remind our readers that we do not have a crystal ball. The observations provided in this commentary are speculative although we do hope it forces our readers to be more skeptical and thoughtful about risk management.
We hope this commentary has given our readers some food for thought. As always, trade safely, and at your own risk.
The next Bitcoin commentary will be published on Monday 25th May 2020. Follow us on Twitter or Reddit to remain up to date with our latest commentaries.
Develop your understanding of trading with our free educational guide that walks you through the five rules you need to master before trading crypto.