Disclaimer: All of the content written on CoinMarketExpert is unbiased and based on objective analysis. The information provided on this page should not be construed as an endorsement of cryptocurrency, a service provider or offering and should neither be considered a solicitation to buy or trade cryptocurrency. Cryptocurrencies carry substantial risk and are not suitable for everyone. See further disclaimer at the bottom of the page.
Flash Alert: Monday 3rd February
What happened after our update on 27th January?
The price of BTCUSDT is up by a further $330 from $8,974 last week to $9,304 at the time of writing today.
In our update last week we observed that Bitcoin is entering the most bullish phase of a bull market megacycle. We also observe that BTCUSDT had been finding good support above the 200-day moving average and that our bullish observations would be confirmed if price manages to end the month of January at current price levels or higher.
We had also noted that the weekly chart was illustrating a bullish MACD crossover and that Bitcoin could be gearing up for a strong rally towards the $10,000 region ( we point out that Bitcoin had reached an intra-day high of $9,618 earlier today, which is not miles apart.)
So where do we stand from here?
Bitcoin has had a good run since the beginning of January, rising from a low of $6,871 to a high of $9,618 earlier today. That represents a 40% gain on the month so in the greater scheme of things, we cannot discount the possibility of seeing some selling pressures creep back into the market.
It is after all very normal and healthy to see some profit-taking following a decent rise in the price. In our opinion, any short-term selling pressures are likely to act as a springboard to propel Bitcoin towards higher highs.
The monthly candlestick chart
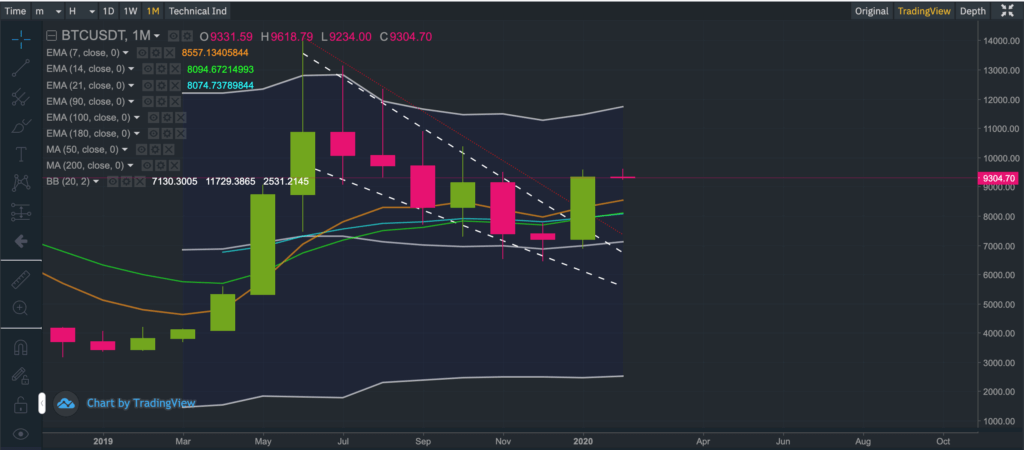
We observe the price of Bitcoin breaching the descending bearish channel on the monthly candlestick chart and trading well above the 7-monthly exponential moving average.
This is an extremely positive sign for the bulls since it confirms that the 6-month bearish tide has officially ended. We now expect the trend for Bitcoin to become increasingly bullish although note the trajectory is hardly ever linear, so be prepared for a few hiccups along the way.
If Bitcoin is dragged lower, we would expect to see good support at the psychological $9,000 level although the monthly chart suggests Bitcoin could fall as low as $8,557 – $8,600, a level that coincides with the 7-monthly exponential moving average.
The weekly candlestick chart
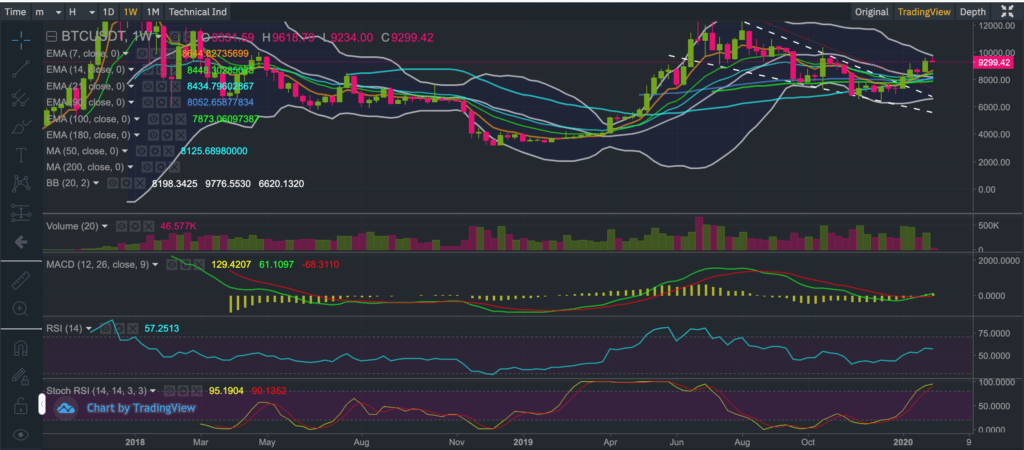
The price of Bitcoin on the weekly candlestick chart is very close to the upper Bollinger Band of $9,777. Once the upper band is reached there is a risk of seeing renewed selling pressure temporarily weigh on Bitcoin.
Interestingly, the 7-weekly exponential moving average resides at $8,644, which is very close to the 7-monthly exponential moving average. This suggests that the $8,600 region is an extremely important level for the bulls to watch out for in the worst-case scenario.
The daily candlestick chart
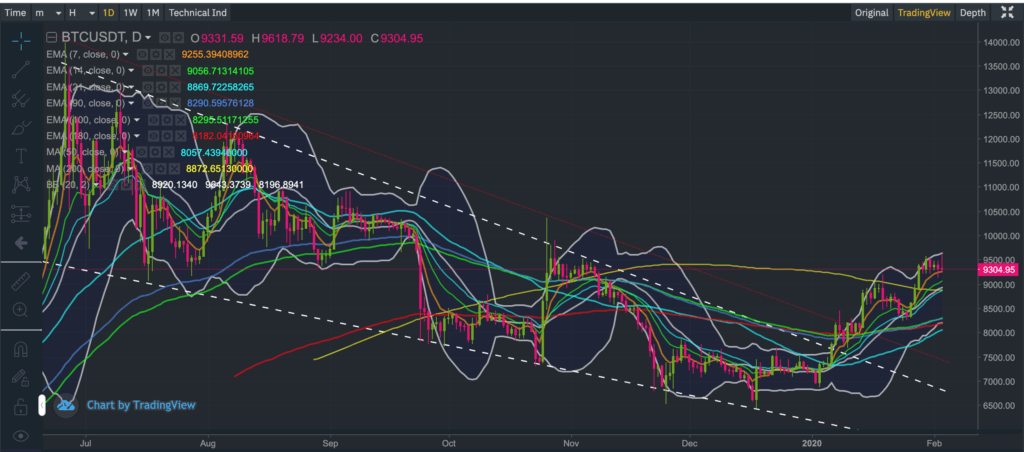
From the daily charts, we see the price of BTCUSDT currently finding good support at the 7-day exponential moving average of $9,257.
We also see the 21-day exponential moving average crossing through the 200-day moving average from beneath, which helps to confirm the underlying trend has turned bullish.
If Bitcoin is struck by a strong bout of selling pressure in the interim period, we expect to see support at the 14-day exponential moving average of $9,000 and if that level is violated we would expect to see support at the mid-Bollinger Band of $8,920 and the 200-day moving average of $8,872.
The key levels of support identified above in descending order are as follows:
$9,257 – 7 day EMA
$9,000 – 14 day EMA
$8,920 – Mid Bollinger Band
$8,872 – 200 day MA
$8,600 – 7 monthly EMA and 7 weekly EMA
As per our previous updates, we reiterate to our audience that we do not have a crystal ball. We attempt to apply a combination of mathematics, fundamental and technical analysis to our updates to provide you with fresh and unique insights although at the end of the day there are no guarantees.
Our derived price scenarios for Bitcoin may not pan out and therefore we warn our growing audience to tread very carefully and at their own risk. Bitcoin is very risky (as you must all know by now) and past performance is not always indicative of the future.
If you enjoy reading our updates and analysis then start following us on Twitter.
The next Bitcoin update will be published on Wednesday 12th February 2020
Anyone interested in reading our previous updates may do so here as they remain valid and provide a good trail for anyone wanting to catch up.
If you’re thinking about trading bitcoin then visit our bitcoin price analysis page. Here we periodically provide interesting bitcoin price insights and analyses that every crypto trader and investor should be aware of.
