Flash Alert: Sunday 15th September
Bitcoin has held its ground well since our previous update on Friday, finding support above its 7, 14, 21 exponential moving averages and resistance around the 50 day moving average – so the net result has been a sideways trade.
We note BTCUSDT did not have the bullish bursting reaction one would have typically seen when breaching critical levels on a triangle or wedge formation (depending on how you see it) so we have gone back to the drawing board and re-angulated the formations and resistance levels – see close up below.
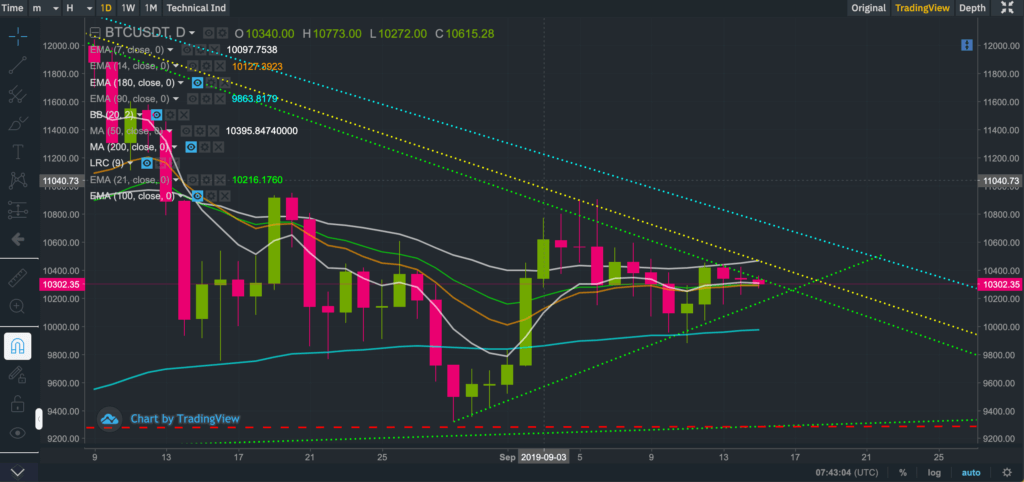
This resulted in the upper bands widening so that critical resistance levels that we previously reported have been pushed further out.
The key lesson for us is that Bitcoin/USD markets, whilst liquid, do not have the deep liquidity that the popular currencies such as GBPUSD or EURUSD have on a daily basis and therefore applying technical analysis patterns on a market that is more inefficient is even more of an art. And this is a good lesson for anyone with a financial markets background to remember when trading Bitcoin and other crypto assets.
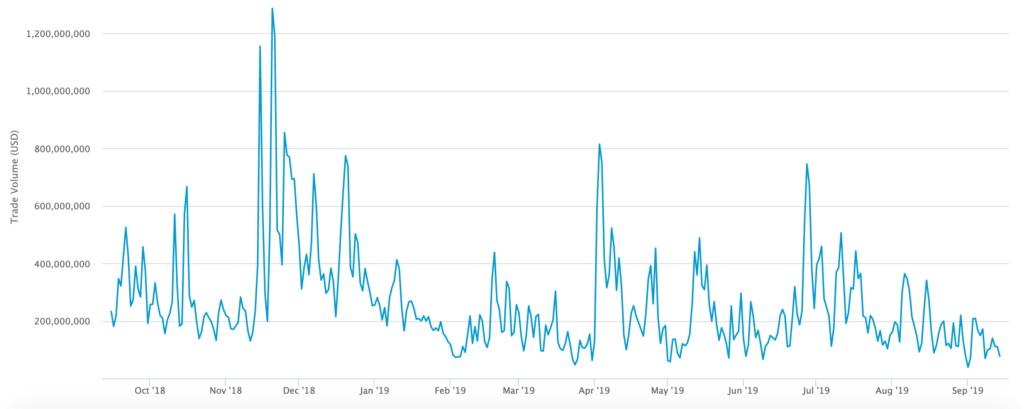
Just to put it into perspective, $5 trillion is traded daily on the forex market, with EURUSD trading flows alone exceeding $500 billion daily. In comparison, Bitcoin/USD volumes are anywhere between $200 million to $2 billion daily so the difference is a significant… And that’s only based on reported volumes (which also includes fake trading volumes).
So where are we with Bitcoin? at the time of writing BTCUSDT was trading at $10,302-$10,305 after previously hitting a low of $10,265.9 and a high of $10,360.
Bulls will want to wait to see whether BTCUSDT can close above the 50-day moving average, currently at $10,465, before becoming too excited. That happens to coincide with the yellow dotted resistance line.
However, HOLDERs looking to top up on a better price will be watching closely to see if support at the 7, 14 and 21 exponential moving averages fails on the daily charts. If it does, then the next support level to watch for is around the $10,000 level, which coincides with the ascending green dotted line that has acted as support on many occasions since the end of August.
Our previous Flash Alerts may read here as they provide a good trail for anyone wanting to catch up with recent price action.
A follow up post to this Flash Alert may be found here.
If you enjoy reading our updates and analysis then start following us on Twitter.
If you’re thinking about trading bitcoin then visit our bitcoin price analysis page. Here we periodically provide interesting bitcoin price insights and analyses that every crypto trader and investor should be aware of.
