Disclaimer: All of the content written on CoinMarketExpert is unbiased and based on objective analysis. The information provided on this page should not be construed as an endorsement of cryptocurrency, a service provider or offering and should neither be considered a solicitation to buy or trade cryptocurrency. Cryptocurrencies carry substantial risk and are not suitable for everyone. See further disclaimer at the bottom of the page.
Flash Alert: Monday 17th February
What happened after our update on the 12th February?
The price of BTCUSDT rose from around $10,400 on Wednesday to reach an intra-day high of $10,500 the following day. However, fortunes quickly turned with the price of Bitcoin seen descending rather sharply since Thursday on rising levels of volatility.
BTCUSDT was dragged to an intra-day low of $9,452.67 today. Over the course of a 5-day period, BTCUSDT has seen a peak-to-trough decline of $1,047.33 or 10%.
So where do we stand from here?
Sentiment appears to be staling, with various traders on Twitter seemingly glued to the four-hour charts. But doing so only leads to short-sighted views – so let us quickly remind you that THE TREND IS YOUR FRIEND.
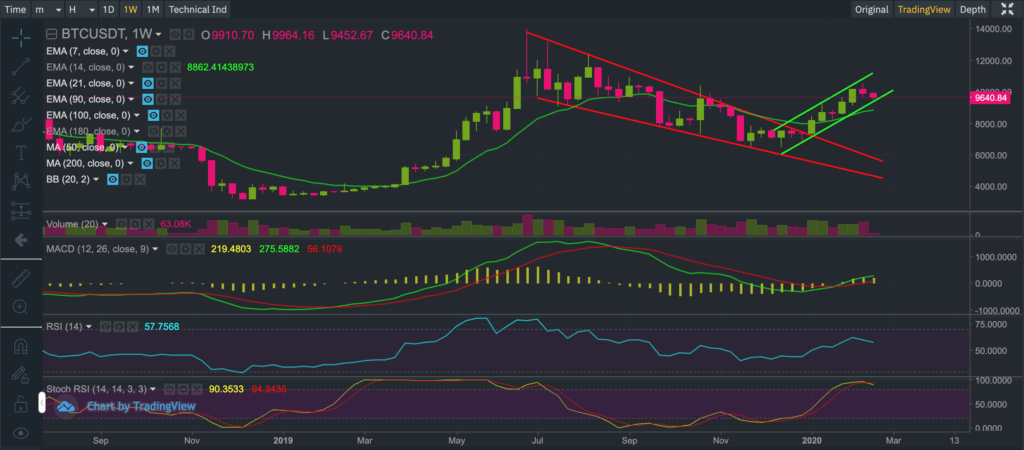
The Big Picture (weekly chart)
a) BTCUSDT has broken out of a descending wedge: a bullish trend
b) BTCUSDT continues to rise within an ascending channel: a bullish trend
c) The weekly MACD continues to gain bullish momentum: a bullish signal
d) The stochastic RSI is overbought: this is a bit of a red flag at the moment since it is emitting a bearish signal although it shouldn’t be viewed in isolation.
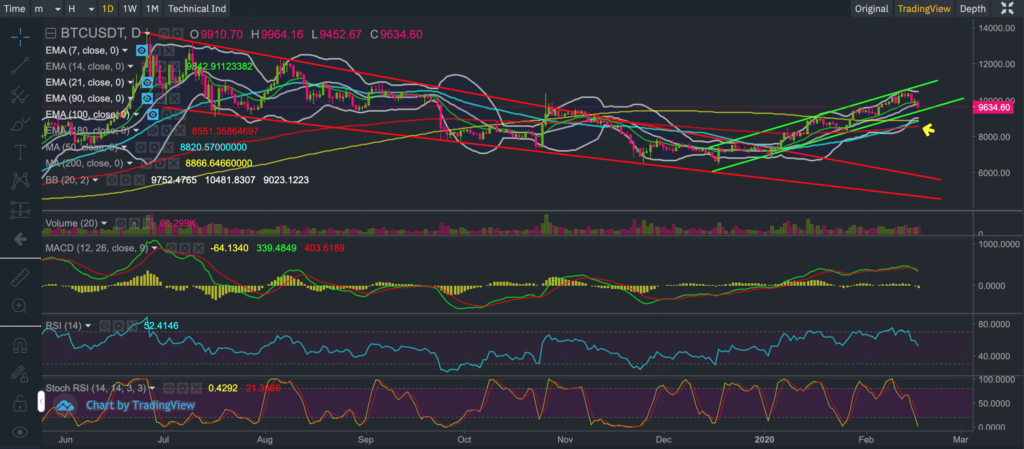
The Big Picture (daily chart)
a) BTCUSDT has broken out of a descending wedge: a bullish trend
b) BTCUSDT continues to rise within an ascending channel: a bullish trend
c) The daily MACD is losing bullish momentum: a bearish signal
d) The stochastic RSI is oversold: likely to become a bullish signal soon
e) The 50-day moving average is just a hairline away from crossing through the 200-day moving average. A GOLDEN CROSS is formed when the 50-day moving average crosses through the 200-day moving average from beneath, and historically GOLDEN CROSSES have proven to be very bullish.
f) And last but not least, let’s not forget the halving (or ‘halvening’ as some of you prefer to call it) is also just around the corner. Halvings have historically been very bullish for Bitcoin, as you may see from our research.
So far, the big picture for Bitcoin remains bullish. If anything we believe Bitcoin is yet to enter the most bullish period of a bull market megacycle with the possibility of reaching a previous high of $14K even before the May halving (‘halvening’).
As per our previous updates, we reiterate to our audience that we do not have a crystal ball. We attempt to apply a combination of mathematics, fundamental and technical analysis to our updates to provide you with fresh and unique insights although at the end of the day there are no guarantees.
Our derived price scenarios for Bitcoin may not pan out and therefore we warn our growing audience to tread very carefully and at their own risk. Bitcoin is very risky (as you must all know by now) and past performance is not always indicative of the future.
If you enjoy reading our updates and analysis then start following us on Twitter.
The next Bitcoin update will be published on Monday 24th February 2020
Anyone interested in reading our previous updates may do so here as they remain valid and provide a good trail for anyone wanting to catch up.
If you’re thinking about trading bitcoin then visit our bitcoin price analysis page. Here we periodically provide interesting bitcoin price insights and analyses that every crypto trader and investor should be aware of.
