Disclaimer: All of the content written on CoinMarketExpert is unbiased and based on objective analysis. The information provided on this page should not be construed as an endorsement of cryptocurrency, a service provider or offering and should neither be considered a solicitation to buy or trade cryptocurrency. Cryptocurrencies carry substantial risk and are not suitable for everyone. See further disclaimer at the bottom of the page.
Bitcoin update: Monday 2nd March
Last updated Friday 6th March 2020, click here to see this Bitcoin daily dairy
| Key Points: | Buy Bitcoin: | |
|---|---|---|
 | ⭐ One of the best crypto exchanges in the market right now! ⭐ High on security and safety (SAFU, 2FA, etc..). ⭐ Largest selection of cryptos to trade. ⭐ Ability to buy crypto with fiat. | |
| | ⭐ leading social trading platform, trusted by millions of users from more than 140 countries. ⭐ Wide variety of trading options (crypto, stocks, ETFs, forex, commodities, etc...) ⭐ Copy the trades of top performing traders and portfolios! ⭐ 0% commissions on all stocks! | |
| | ⭐ Legitimate crypto exchange and trading platform. ⭐ Low trading and exchange fees. ⭐ Free practice demo account with 50,000 USDT. ⭐ Make your first deposit and receive a 25 USDT Welcome Bonus. | |
| Disclaimer eToro is a multi-asset platform that offers both investing in stocks and crypto assets, as well as trading CFDs. CFDs are complex instruments and come with a high risk of losing money rapidly due to leverage. 67% of retail investor accounts lose money when trading CFDs with this provider. You should consider whether you understand how CFDs work and whether you can afford to take the high risk of losing your money. Past performance is not an indication of future results. Cryptoassets are volatile instruments that can fluctuate widely and therefore are not appropriate for all investors. Other than via CFDs, trading crypto assets is unregulated and therefore is not supervised by any EU regulatory framework. eToro USA LLC does not offer CFDs. eToro USA LLC makes no representation and assumes no liability as to the accuracy or completeness of the content of this publication. This publication has been prepared by our partner utilizing publicly available non-entity specific information about eToro. | ||
Overview
We begin this update with a summary of the previous week’s commentary, outlining where we had gone wrong. We also provide some reflections on Bitcoin trading that we hope you will find educational and examine Bitcoin’s safe-haven properties.
In the final section of this update, we put some beef on the bone and present fresh insights from our research, which we hope sheds some light on where Bitcoin may be heading to next.
Summary of last week’s update
In last week’s update, we had observed some trepidation creeping back into the market as the bullish ascending channel began to breakdown after the price of Bitcoin began to trade sideways.
At the time, we had observed a pattern beginning to emerge and in retrospect correctly pointed out that we “cannot discount the possibility of seeing a temporary period of lower lowers.”
In last week’s update, we stated that it is a natural proclivity for Bitcoin to go through a ‘shake-out‘ phase at the beginning of a bull market cycle, particularly following a breakout of the magnitude we saw since January.
Now, this is part we got terribly wrong.
Last week we were of the opinion that in the worst-case scenario, Bitcoin could see a drop to $9,000 although we felt more confident going with a more bullish base-case scenario whereby Bitcoin is likely to trade sideways for a while, finding good support between $9,400 and $9,500. In retrospect, we should have looked deeper into the research and not attempt to guess possible TA outcomes.
At the time we felt that a ‘shake-out‘ is a necessary condition for Bitcoin to garner sufficient ‘momentum‘ to break through a recent plateau of $10,500 and to continue on an upward trajectory. We still believe there is merit to this observation although, at the end of the day, we need to be open to the possibility that this isn’t a conventional shake-out but rather the beginning of a new leg down perhaps back towards the $5,000-$6,000 region or even lower.
Reflections from the past week
We hope you find the following reflections to be educational.
Psychology
1. The trend is your friend
Trends are time-frame specific with bigger timeframes usually carrying greater weight although at the same time don’t underestimate short-term price action and what it may be signaling. It is a delicate balance that even the most experienced trader gets caught up with.
2. Keep it simple
MACD, RSI, and stochastic indicators, in general, are all valuable although always go back to basics to monitor key support and resistance levels together with volume.
3. Confirmation bias
You may fall into this trap unintentionally when others have the same views. We are all guilty of it. As a trader, never let your guard down. Being skeptical at all times is healthy.
Trading & Analysis
4. Risk Management
We have been good at anticipating and preparing for periods of rising levels of volatility.

Two weeks ago we understood that Bitcoin volatility was on the increase and managed our mitigate our overall risk by deleveraging, and luckily so because we did not anticipate the current dip to be so fierce.
4. Bitcoin futures price gaps
Never ignore price gaps in Bitcoin futures (CME, CBOE, Bakkt). Many seem to get filled sooner or later!
5. Hedging long exposures
The traditional long-only “HODLERS” that own physical Bitcoin may want to consider the benefits of hedging in a downturn. You could do this with put-options or you could also build a short leveraged exposure to protect your unleveraged long position.
If you are genuinely interested in learning more about hedging your Bitcoin positions ping us on Twitter. If there is interest we will produce a guide for you.
6 Research
Bitcoin is not driven by mechanisms that govern the fiat economy such as interest rates (monetary policy) but more so by market sentiment, overall adoption, mining activity, block mechanisms, and “market makers” (we will refrain from being too controversial right now).
We find that our Bitcoin research captures many of these intrinsic trends. It is important we continue to draw conclusions from various research and insights (and not only TA).
At the same time we need to remind ourselves to keep an open mind because past performance is not always indicative of the future. And this is especially important because the Bitcoin trading landscape has been evolving with the introduction of institutional platforms, margin, and futures trading over the past year and a half.
6. Bitcoin as a safe-haven
We really drill down on this topic in this section. The concept of a safe haven really boils down to perceptions, which is both contextual and time specific.
Salt was considered a safe haven during the Roman times although gold has withstood the test of time.
What is a safe haven?
A safe-haven asset appreciates in value during periods when fear and panic creep into a market. Gold and US Government bonds, both denominated in US dollars, have historically acted as the ultimate safe-haven assets during periods of risk aversion, especially in developed economies.
Is Bitcoin a safe haven?
The evidence shows that Bitcoin has not consistently behaved as a safe haven.
Analyzing the daily price returns of gold (widely considered a safe-haven asset) and Bitcoin, we may see that from a mathematical perspective there is no consistent (or statistically significant) relationship.
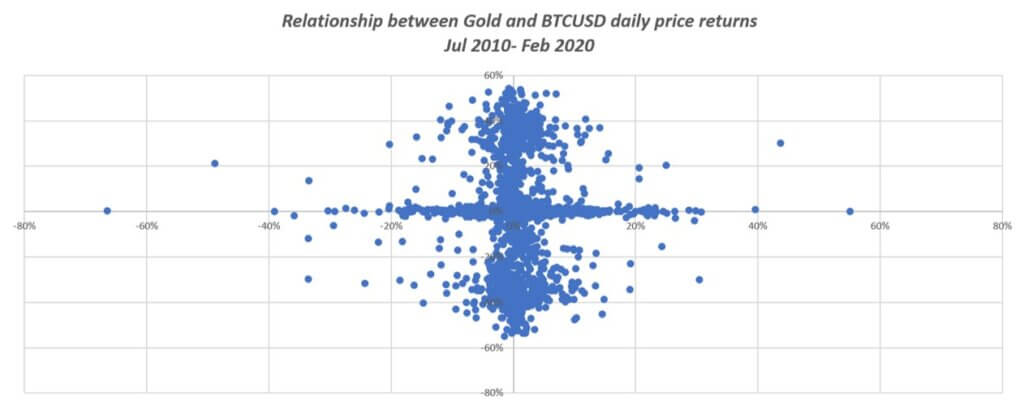
Whilst Bitcoin does not appear to exhibit a statistically significant relationship with gold, the chart below suggests there is a periodic correlation between gold and Bitcoin.
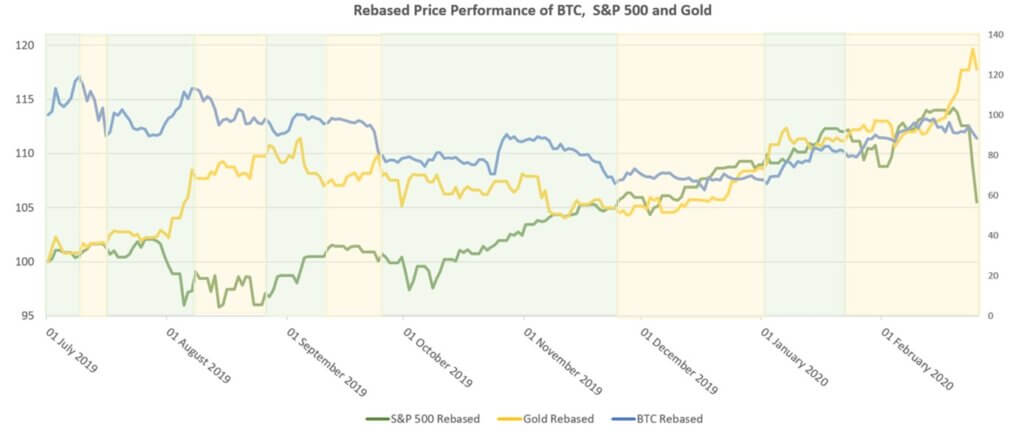
The chart above illustrates the rebased price performance of the S&P 500 Index, Bitcoin and gold between 1st July 2019 and 20th February 2020. The green shaded areas of the chart show periods when the rebased price of Bitcoin and gold are correlated whilst the yellow shaded areas point to periods when those correlations break down.
What could be the possible reason for this periodic correlation between gold and Bitcoin?
Let’s start by saying that correlations do not imply causation. However, remember a safe haven really boils down to perceptions, which is both contextual and time specific.
It is very logical to see how Bitcoin could be perceived as a safe haven for people residing in markets that are deemed to be emerging and underdeveloped. Many developing economies have a history of economic and political instability and their national currency does not carry a reliable store of value. For many investors that fall into this category, it is very reasonable to comprehend how Bitcoin could be perceived as a safe haven and a store of value. For simplicity, let’s call this group “developing economy investors.”
In contrast, the vast proportion of global investors (let’s categorize them as “developed economy investors” for simplicity) do not perceive Bitcoin as a store of value or safe-haven asset. This group (which consists of pension funds, banks, etc) is far larger in size and value than their “developing economy” counterparts. At the very best, a very small and insignificant proportion of the investors in the “developed economy” category may have allocated a 3%-6% Bitcoin exposure to their portfolios for potential diversification benefits.
Do you see where we are going with this?
It therefore stands to reason that during periods of global uncertainty and risk aversion, as we have seen recently as a result of the Corona virus (“COVID-19”) outbreak, “developed economy investors” will sell perceived risk assets and diversify into perceived safe-haven assets such as gold and U.S. government bonds. Since the money flows from “developed economy investors” is significantly more material, it completely outweighs the smaller money flows from “developing economy investors”.
This interplay between the large “developed economy investor” money flows and the smaller “developing economy investor” money flows during periods of global risk aversion could be one of the reasons why the periodic price correlations seen between gold and Bitcoin rise and fall.
If Bitcoin had to be valued on par with gold right now, how much would each Bitcoin be worth?
We definitely would not bet on that happening anytime soon. However, if we have to do the math, the price of each Bitcoin would be worth between $465,518 and $535,826.
The World Gold Council estimates that 190,040 metric tonnes of gold have been mined throughout history – and the net supply is more or less stable. So if we use that as a good proxy for ‘circulation supply’ and apply the latest gold spot price of around $1,600 per ounce, a hypothetical gold ‘market capitalisation’ of $9.78 trillion is derived (since there are 32,150.75 troy ounces per metric tonne).
Based on the current gold market capitalisation of $9.78 trillion and a Bitcoin circulation supply of 18.24M, the hypothetical price of each Bitcoin would be $535,826 or more conservatively $465,518 (if we apply the max circulation supply of 21M). That’s a stratospheric gain of 5,377% – 6,204% from the current price!
Is Bitcoin a good stockmarket hedge?
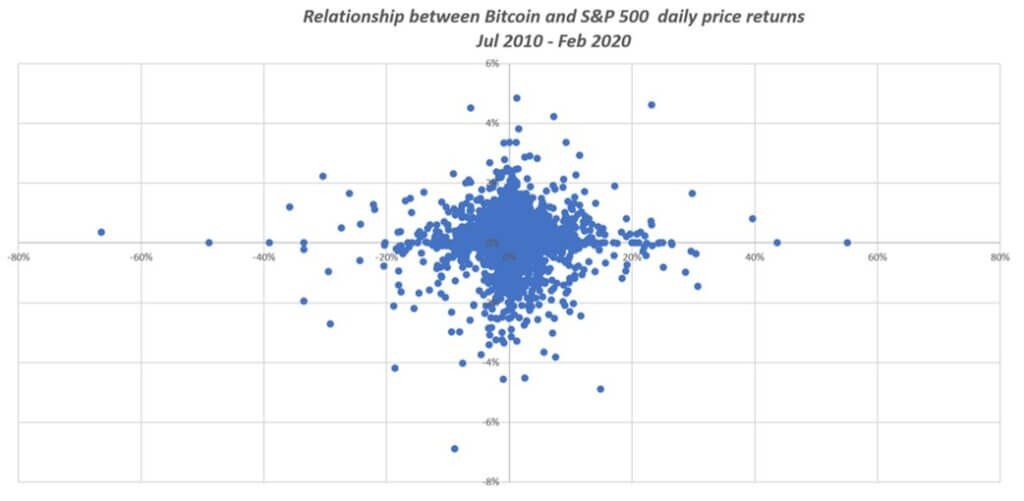
The daily returns of Bitcoin are generally uncorrelated with the stock market. As alluded to above, Bitcoin is not perceived in the same way as gold by the large institutional investors, although a few do see its use as a diversification asset.
To put this into perspective for you between 19th and 25th February, the S&P 500 index had declined by approximately 7.6% whereas Bitcoin had fallen by 3%. In contrast, gold climbed 2.3% over the same period
A regression analysis of the daily log returns for the S&P 500 and Bitcoin indicates there is no statistically significant relationship.
This implies that Bitcoin could offer diversification benefits to a fiat-based portfolio. As a matter of fact, the following chart shows the BTCUSD/S&P 500 price ratio between 2017 and February 2020.
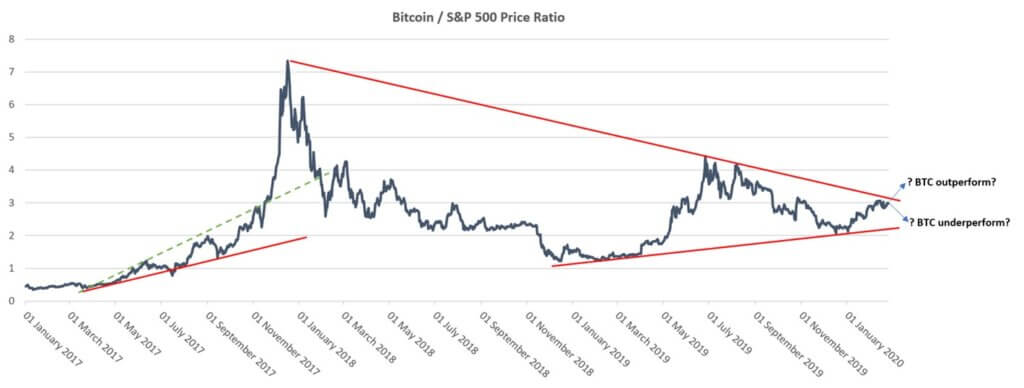
We can clearly see periods when the price of Bitcoin had outperformed the S&P 500 index (when the Bitcoin/S&P 500 Price Ratio rises) and conversely we can see periods when the price of Bitcoin had underperformed the S&P 500 (when the price ratio falls).
We can see that Bitcoin has gone through multiple cyclical periods of relative outperformance versus the S&P 500, which adds weight to the Bitcoin-portfolio-diversification-benefit argument.
So where do we stand from here?
We remain bullish, as the research suggests Bitcoin has already found a bottom and preparing for another major leg upwards. Notwithstanding the evidence provided by our research, we must maintain a skeptical mindset since the landscape over the past year and a half has changed dramatically with the introduction of futures and margin trading, which have significantly raised market volatility.
Bitcoin Logarithmic Chart: The Big Picture
Having re-examined our logarithmic chart thoroughly, we continue to believe Bitcoin is going through a shakeout period, which historically appears to be the norm during a recovery phase.
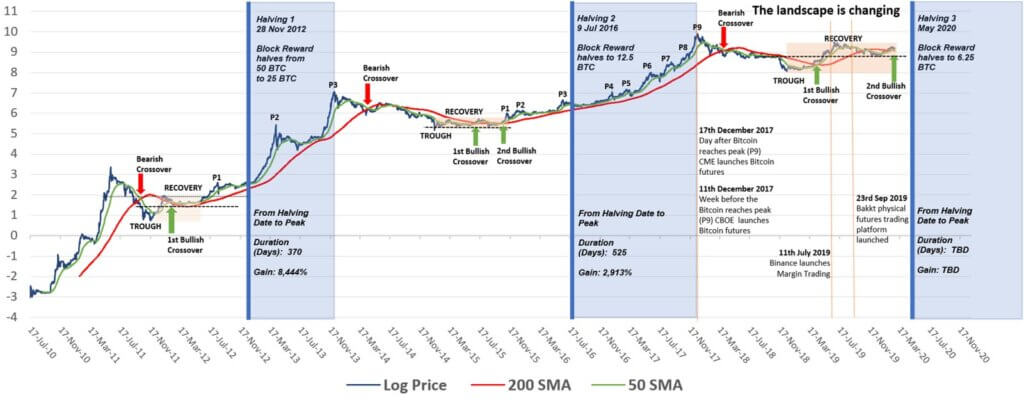
The Bitcoin logarithmic chart has been segmented into three sections illustrating the pre-and-post halving performance of Bitcoin. We may clearly see that Bitcoin’s price performance really starts to go into overdrive after its halving (“halvening”) period (not before).
Furthermore, we also included the 50-day and 200-day simple moving averages (based on the closing price of Bitcoin) to understand whether “golden crosses” and “death crosses” carry any merit on the daily charts.
A golden cross is when the 50-day simple moving average crosses through the 200-day moving average from beneath (and is meant to be bullish) whereas a death cross occurs when the 50-day simple moving average crosses through the 200-day moving average from above (and is meant to be bearish).
Based on the chart above, we observe a few compelling insights:
1) Death crosses on the daily chart have done well historically at confirming bear markets;
2) Median death-cross-to-trough declines equate to 53% (range: -49% to -64%);
3) Median peak-to-trough declines equate to 85% (range: -84% to -93%);
4) Median trough-to-golden-cross increases equate to 63% (range: +63% to +190%)
To our surprise, the current cycle appears to satisfy all of the above proportions really well, which suggests Bitcoin could have already found its bottom.
What is also interesting to point out is that after a golden cross is formed there is typically a 20%-30% “shakeout” or declines from a recent peak price. Assuming history repeats itself, this implies the price of Bitcoin could potentially decline anywhere between $8,325 and $7,324 before potentially reversing into a strong bullish uptrend.
We observe that Bitcoin has recently reached a low of $8,411, which in the greater scheme of things is only 1% away from $8,325 identified in our research so perhaps we shouldn’t be too fussy about a precise figure.
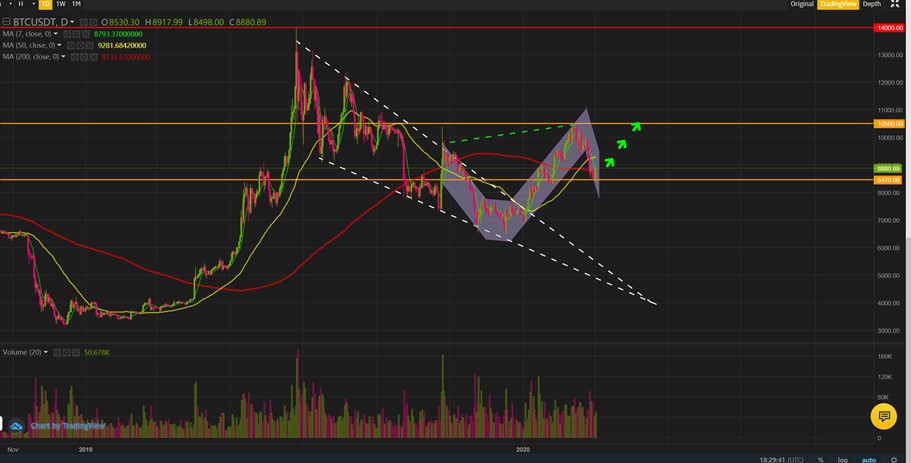
It is also really interesting to point out that a bullish teacup pattern on the daily and weekly charts appears to be forming, which adds weight to the view that Bitcoin could soon encounter a very strong bullish bounce.
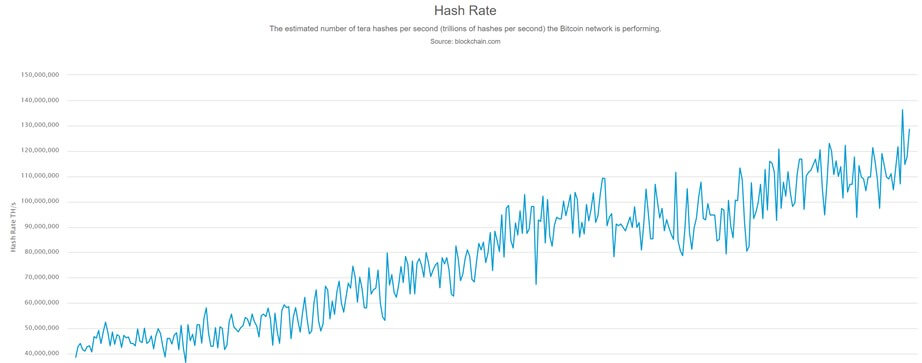
We also note that the hash rate has spiked overnight to touch a new record high, as may be seen from the chart below.
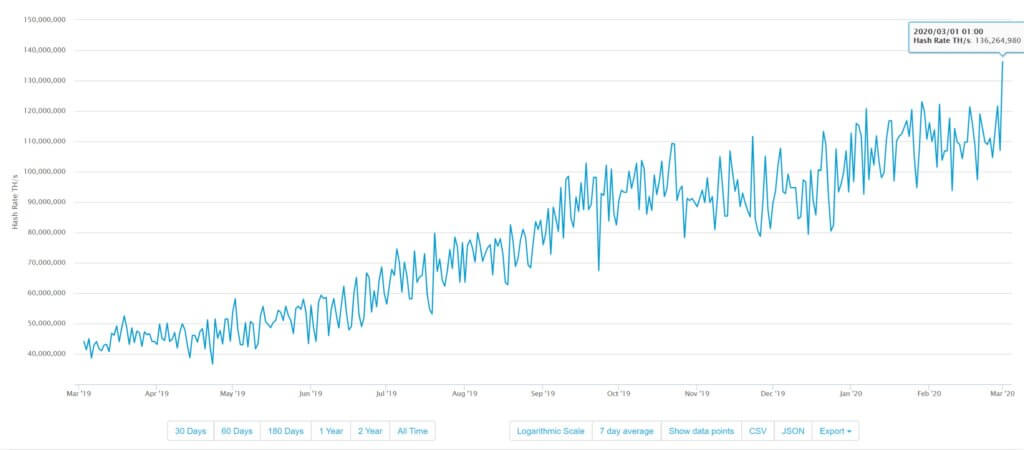
The latest hash rate spike to 136,264,980 implies that Bitcoin’s hypothetical fair value could be $22,384. That suggests Bitcoin is undervalued by more than 150% (based on the current price of $8,850). Apart from that, it is also one of the widest spreads we may recall seeing between the derived hypothetical fair value of Bitcoin and the actual price! Our research covering the relationship between the value of Bitcoin and its hash rate may be found here,
At the time of writing BTCUSDT was trading at $8,850 following an earlier struggle to gain traction above $8,900. Based on the price action we have seen so far today we cannot discount the possibility of seeing Bitcoin lose further momentum and fall much further (perhaps to $7,324 or more).
However, the research conducted so far supports a very bullish view on Bitcoin. We also believe the recent decline to $8,411 could sufficiently meet the criteria for a strong bounce. We will nonetheless be watching closely to see if BTCUSDT can at least regain some turf above the psychological $9,000 mark before becoming too excited. If it does, our confidence in Bitcoin heading for another major bullish increase will begin to rise!
Bitcoin Daily Diary: Tuesday 3rd March
Bitcoin has failed to regain ground above $9,000 and we are continuing to see intense selling pressures re-enter the market. At the time of writing BTCUSDT was trading at $8,700, down from an earlier high of $8,919.
We believe the short-term price action could be signaling steeper declines may be in store. In the absence of any strong buying activity, we are now raising the probability of seeing a potential drop towards the $7,324 – $6,500 region and will continue to monitor the price action over the following days.
Although the probability of seeing further short-term declines is rising, we still believe Bitcoin has entered a very bullish phase in its cycle. Recovery periods, especially in the pre-halving phase, have historically exhibited steep shakeouts (although the tricky part is understanding when a shakeout has ended).
Bitcoin Daily Diary: Wednesday 4th March
Since 26th February, Bitcoin has been rangebound between $8,411 and $8,965-$8,971.
Between 1st and 4th March, we have seen renewed buying resurfacing around the $8,450 level which has reinvigorated appetite and lifted Bitcoin towards $8,900, where increasing selling pressures begins to re-emerge to cap gains.
Over the last 24hrs, we have seen BTCUSDT make an attempt towards the psychological $9,000 level only to lose steam around $8,965 before being knocked back to $8,652.
So far on the intra-day charts, we are detecting increased BTCUSDT selling around $8,825 with buyers re-emerging around the $8,785 level.
It is interesting to point out that CME Bitcoin futures are currently in contango, a situation where the futures price is higher than the spot price, as may be seen below.
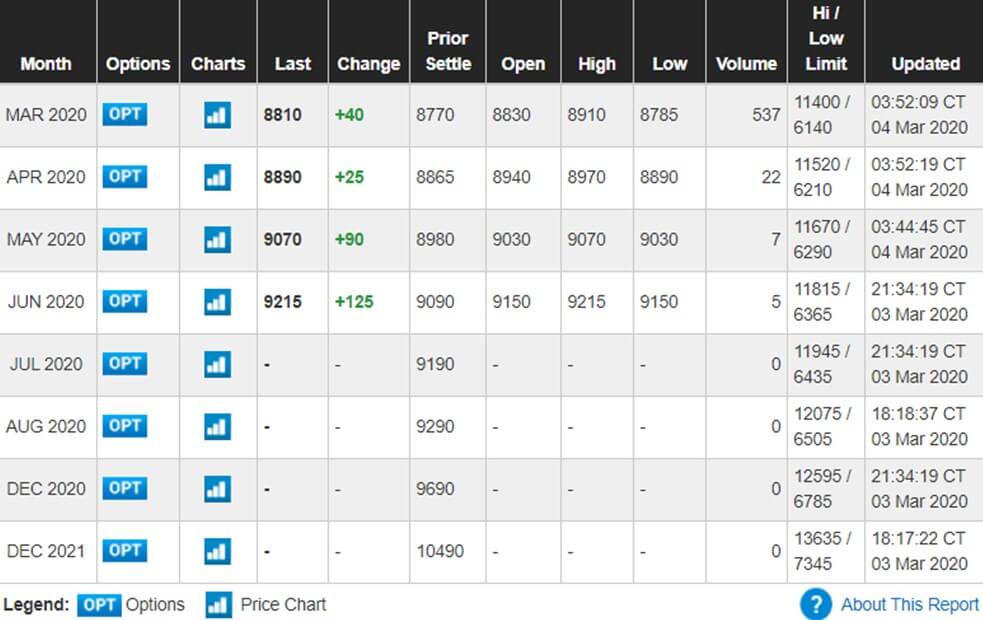
Contango typically suggests the market is expecting the asset price to rise over time. In this case, it suggests the overall market, in general, remains bullish over the future price performance of Bitcoin. What’s interesting to do is to see how the price of each monthly contract is changing to understand whether the curve is becoming steeper or flatter over time.
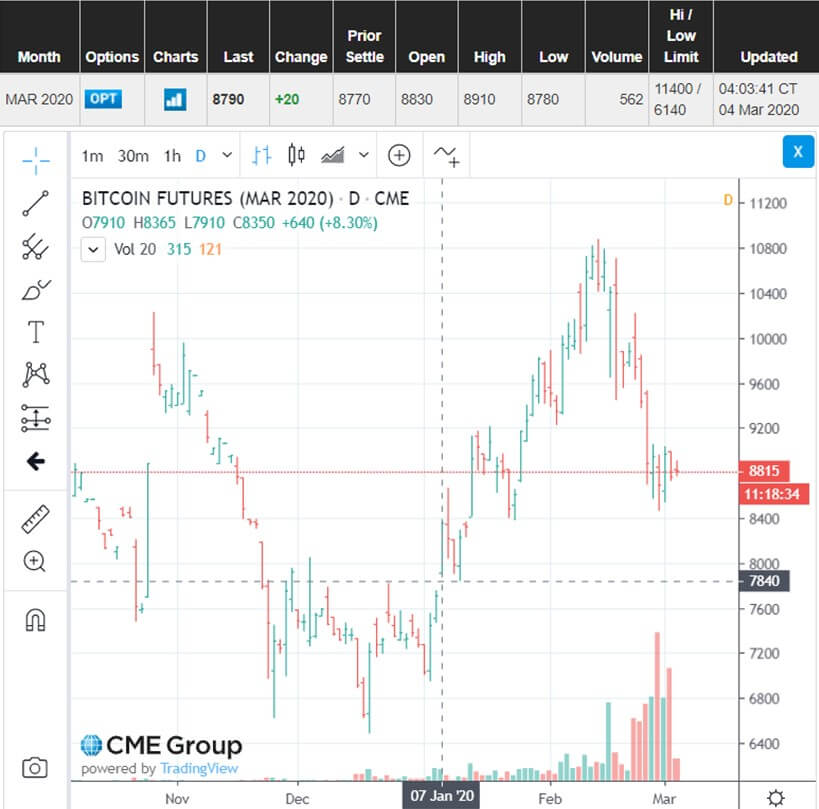
We also point out that there is a CME futures price gap in the March contract that resides between $7,750 and $7,850. This gap has not been filled yet!
Bitcoin Daily Diary: Thursday 5th March
There has been a lot of mixed feelings towards Bitcoin over the last couple of days.
Over the last three days, BTCUSDT has encountered resistance around $8,940, although on each of those days has seen higher lows. So what we are seeing is a potential bullish ascending triangle or bullish pennant pattern beginning to form on the 2hr charts, as may be seen from the chart below.
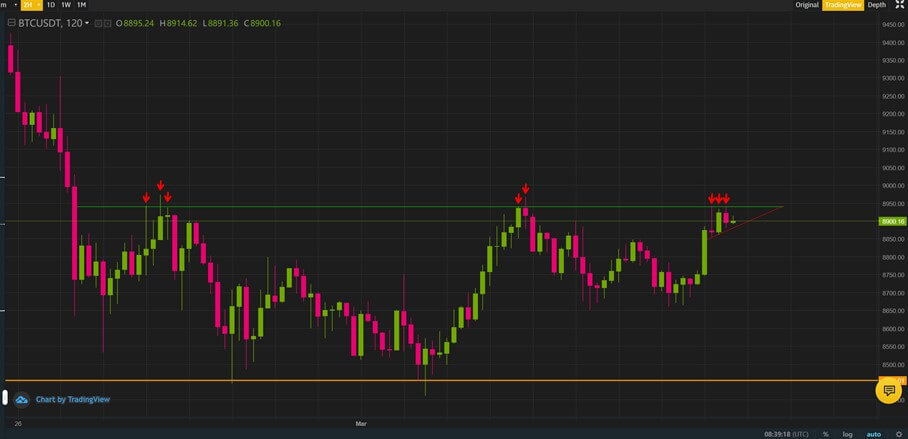
Furthermore, we note the MACD on the daily charts is beginning to move into a bullish condition.
Based on the most recent price action there is the possibility of seeing a breakout unfold that could see BTCUSDT test the $9,500 level If it manages to clear through the psychological $9,000 level. But before becoming too excited we must keep an eye on $8,940 level first.
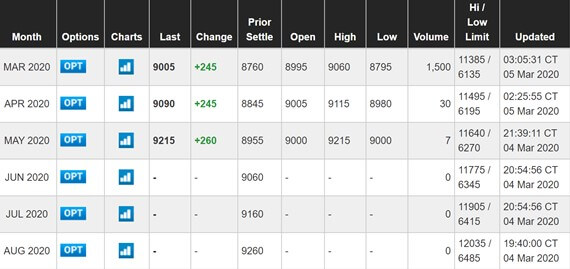
In the meantime, we note that CME Bitcoin futures remain in contango (and appear to be steepening). We also observe that the March futures contract has already hit $9,000, as may be seen below.
Furthermore, we also observe another upward spike in the Bitcoin hash rate since yesterday, as may be seen below.
As you may see, Bitcoin sentiment today is turning increasingly more bullish!
Bitcoin Daily Diary: Friday 6th March
Bitcoin has traded mostly sideways over the last 24-hours, with gains in BTCUSDT seen capped around the $9,120-$9,170 region – so this is an area you should continue to watch closely!
In the following sections we breakdown many angles to help you make up your own mind on where Bitcoin may be heading. We begin by outlining the overall trend and proceed to look at potential pattern scenarios, CME price gaps and more.
We hope you find the various angles useful in helping you make up your mind because at any moment Bitcoin could blast off in any direction! For those following us, you must know by now that we are Bitcoin bulls but we cannot discount the potential downside either – so trade carefully and buena suerte!
Current Bitcoin trend: Bullish
Moving averages reflect trends. Our research shows that death crosses and golden crosses have historically been quite good at confirming the direction of trends.
A golden cross was formed between 17th-18th February 2020. This is, in fact, the second golden cross (over the current period) seen in the run-up to the next halving (“halvening“) in May. Historically it has not been uncommon for golden crosses to form right before a mega bull market rally. These so-called ‘mega rallies’ appear to become ignited shortly after the halving date (not before).
The research (above) indicates that golden crosses tend to occur during a “recovery phase” although during this period it is not uncommon to see a shakeout, as may be seen from the illustration below also.
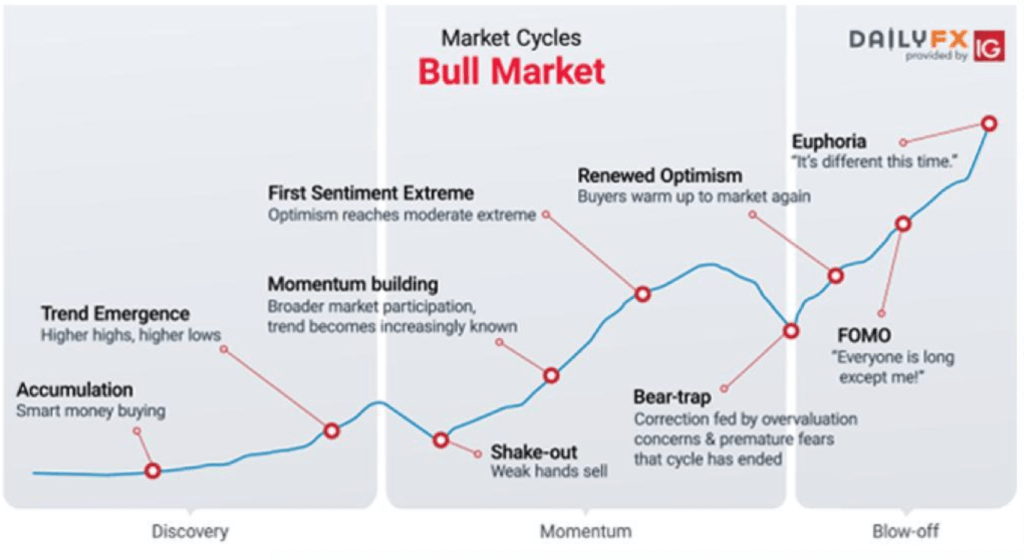
Our research indicates that historical shakeouts for Bitcoin have been to the tune of 20%-30%. However, in reality there is no hard and fast rule of how deep a shakeout can go. It does nevertheless indicate that you should not let your guard down and remain careful about how you manage your risk during a recovery period.
In other words, just because there is a golden cross it doesn’t mean you can go all out because it will most likely be a bumpy road ahead. Hopefully, this is already clear to you. Risk managment is always key!
Golden Cross: Bullish
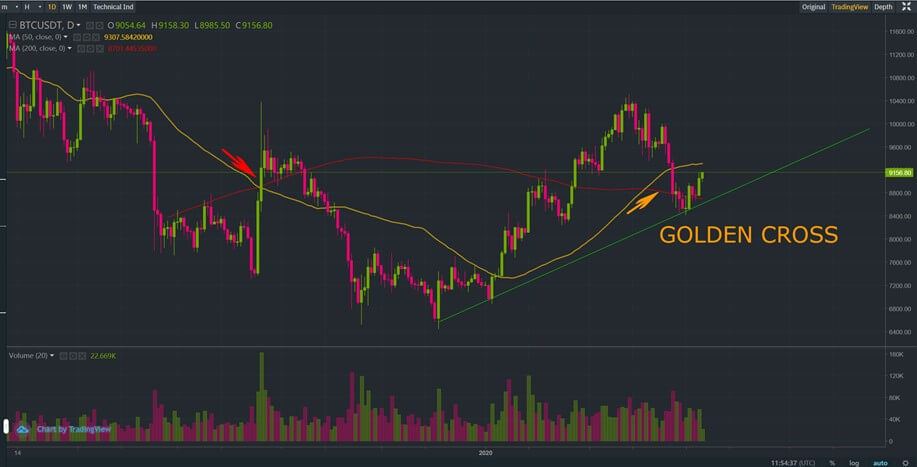
Despite showing a golden cross its never straightforward, unfortunately. If we look at the buy volumes over the last week it has been relatively low – could this be a red flag?
Bitcoin potential scenarios: Mixed
Let’s now turn our attention to the different POTENTIAL patterns that could be forming. This is dangerous and risky but we need to see all the potential scenarios to be able to make a more informed decision.
Teacup: Bullish
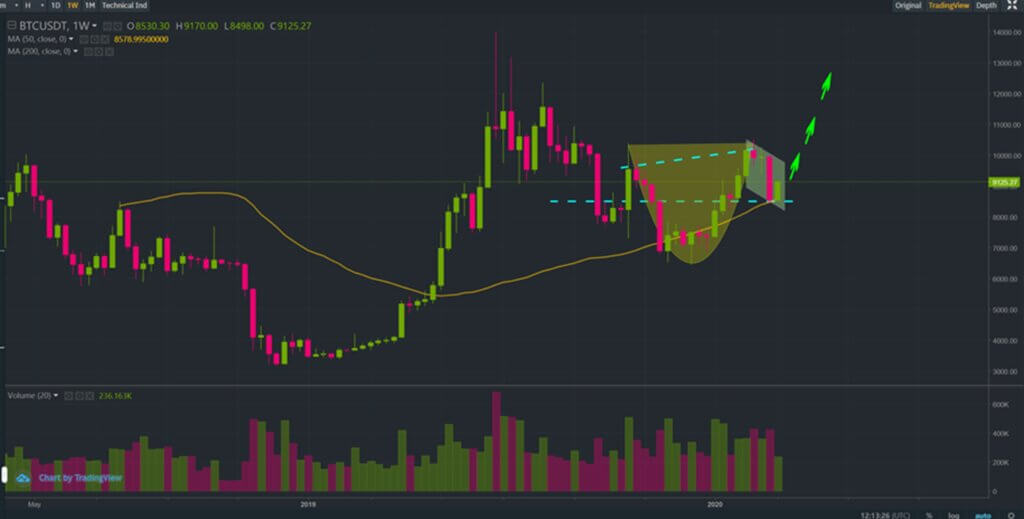
Could Bitcoin be forming a bullish teacup formation? Maybe? It does look like one.
Reverse Head and Shoulders: ST Bearish, LT Bullish
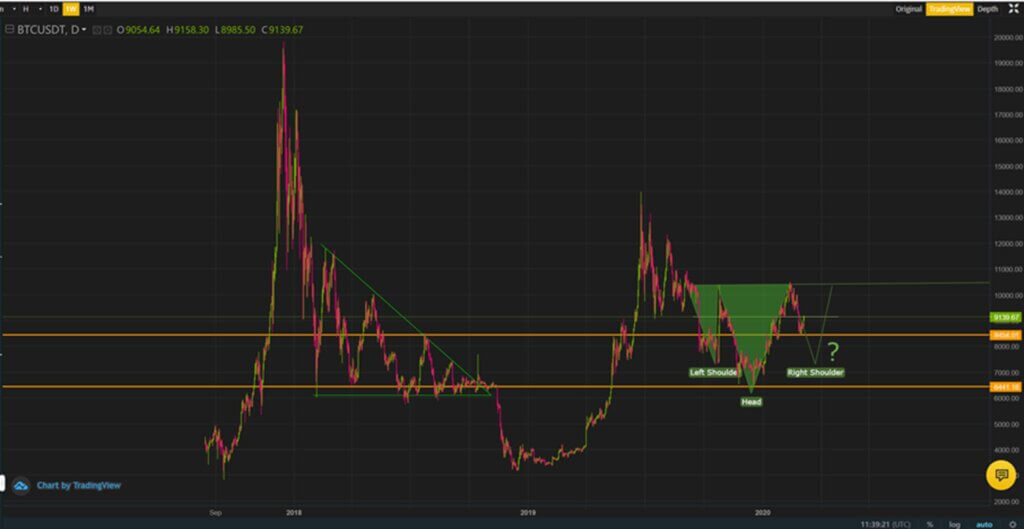
You could also say Bitcoin is in the process of forming a reverse head and shoulder pattern. This would be bearish in the short term as it suggests Bitcoin would have to correct to anywhere between $7,800 – $7,300 before going into overdrive and spiking higher.
Now, this is really interesting because as we pointed out earlier this week that there is a CME futures price gap in the March contract. The price gap resides between $7,750 – $7,850 and has not been filled yet!
Head and Shoulders: Bearish
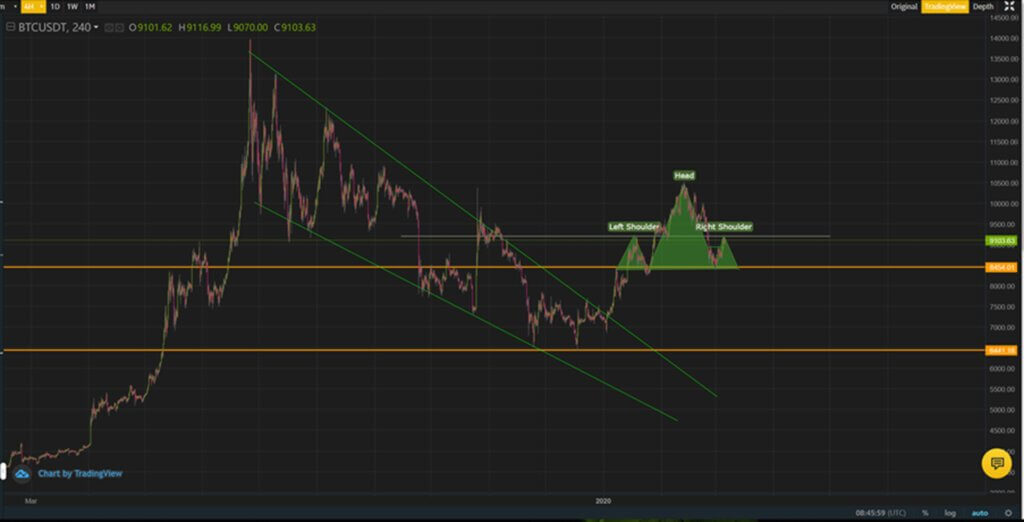
Moving on….. we could even make the case for a head and shoulders formation. Admittedly, it’s not the best looking heading and shoulders pattern but that would imply that Bitcoin may correct all the way back to $6,500-$6,000.
Ascending Broadening Wedge: Bearish
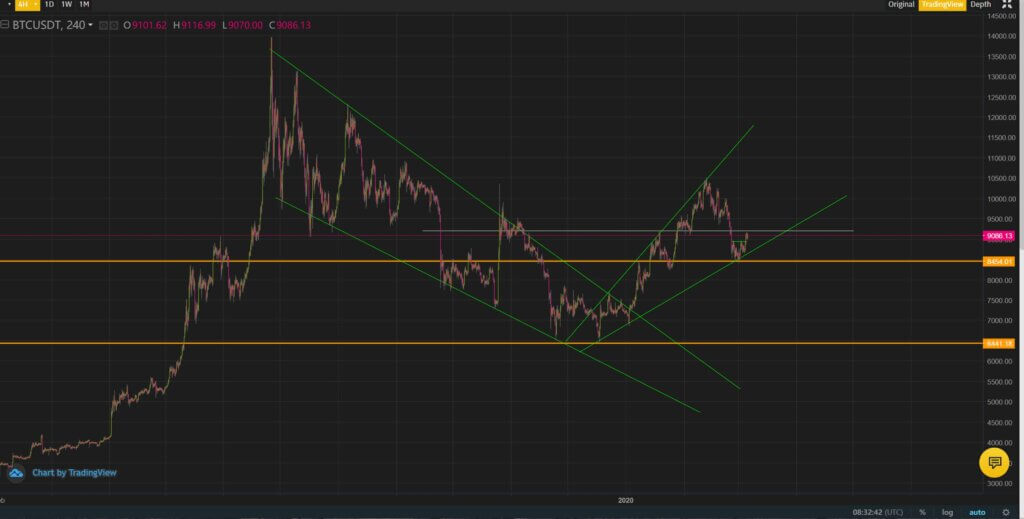
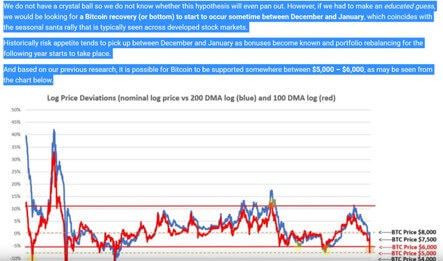
And finally, we can even make the case for a bearish ascending broadening wedge, which could see Bitcoin driven all the way back to around the $5,000 level and completely risk derailing the current overall bullish trend!
Ironically, previous research has picked up on this potential outcome as well: not only predicting when risk appetite in Bitcoin could pick up (between December 2019- January 2020) but also suggesting that Bitcoin could possibly fall within the $6,000 – $5,000 range before spiking higher.
Other Considerations
Bitcoin hash rate: trending higher (bullish signal)
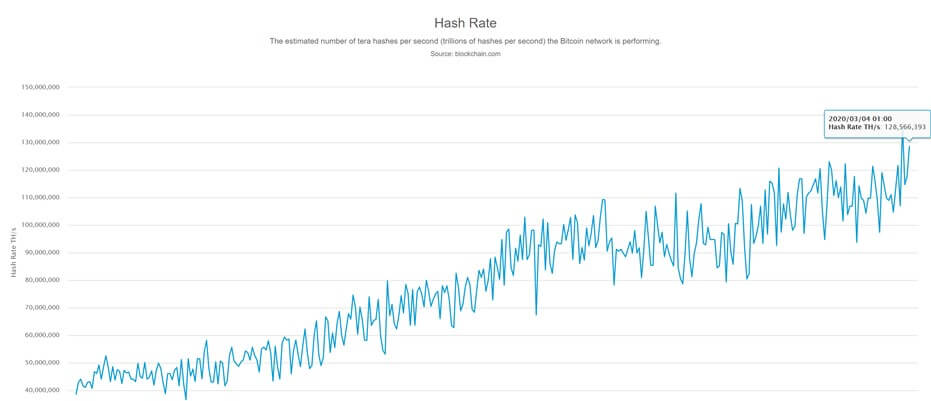
The Bitcoin hash rose 12% from yesterday’s level to 128,566,393. That compares to a record high of 136,264,980, reached on Tuesday.
A rising hash rate has tended to be bullish on the price of Bitcoin although this is a very volatile metric that may swing in any direction on any given day so we wouldn’t look too much into the daily swings but rather remain focused on the general trend.
We follow the Bitcoin hash rate because our research indicates there is a relationship between the value of Bitcoin and its hash rate. Our research may be found here: you also may play around with the hash rate calculator at the bottom of that page to simulate the hypothetical fair value of Bitcoin vs its hash rate.
CME futures: Contango (bullish – but be aware of the daily deltas)
We note that CME futures remain in contango, which suggests the market is expecting the price of Bitcoin to be higher in the future. However, we note that since yesterday there has been a flattening of the curve.
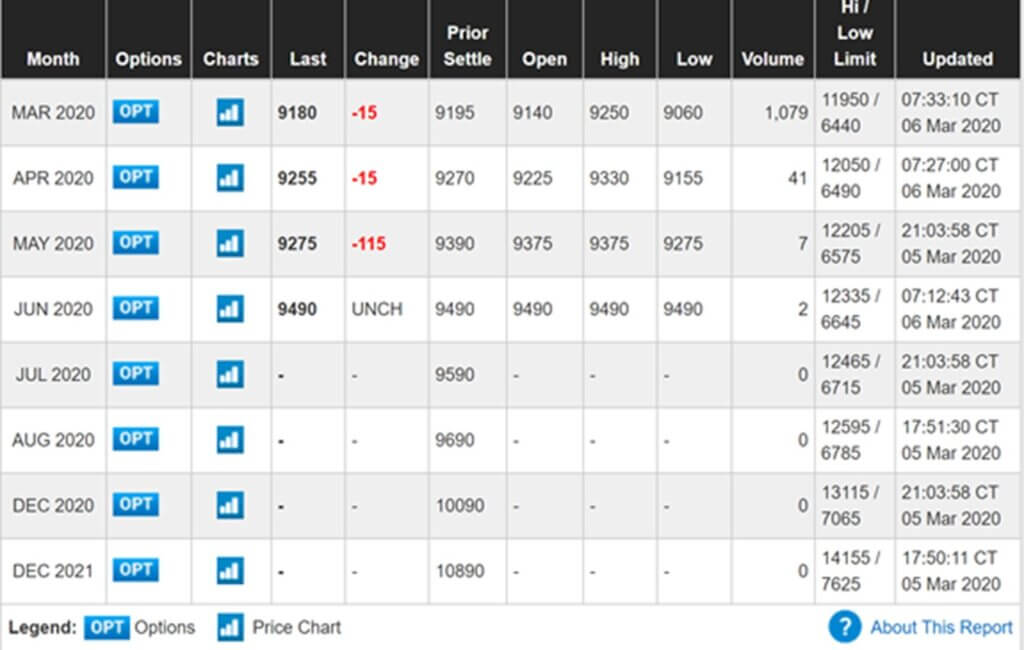
Keep an eye out on whether the contango is steepening (and becoming more bullish) or flattening ( and becoming less bullish/ more bearish) over time.
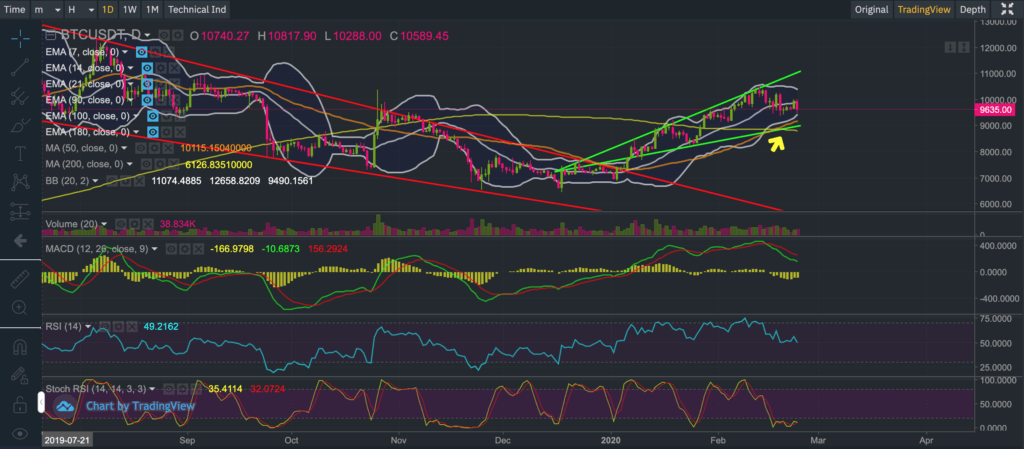
Moving Averages, RSIs, MACD: Mostly bullish
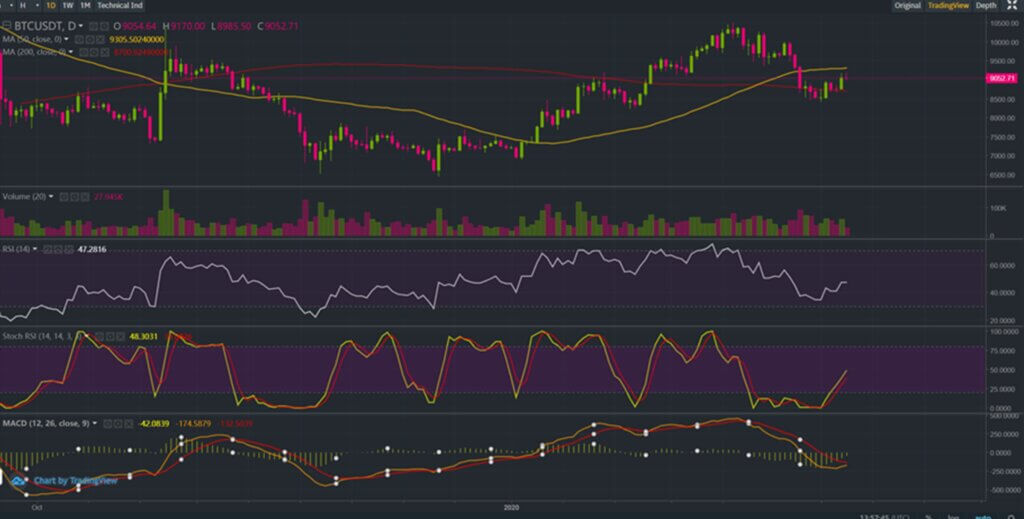
We may see the 14-day RSI swinging in a bullish direction together with the stochastic RSI in the chart above. Meanwhile, the MACD is moving from a bearish condition to a bullish one. This confirms the bullish trend that we are currently seeing – right now. It still stands to be seen whether MACD can manage to crossover and gather increased bullish momentum.
We also note that BTCUSDT has encountered some resistance between $9,160-$9,170, a level that coincides with the 50-day exponential moving average. This resides just beneath the 50-day simple day simple moving average. If BTCUSDT continues to encounter rejection at the 50-day EMA and/or 50-day MA, we could see a sharp reversal.
In the greater scheme of things, anything is possible. We have laid it all out for you to ultimately decide. With this update, we have concluded our Bitcoin Daily Diary experiment.
We hope you found our Bitcoin commentaries interesting and educational. Trade safely, and at your own risk.
Where to Buy Bitcoin?
| Key Points: | Buy Bitcoin: | |
|---|---|---|
| | ⭐ One of the best crypto exchanges in the market right now! ⭐ High on security and safety (SAFU, 2FA, etc..). ⭐ Largest selection of cryptos to trade. ⭐ Ability to buy crypto with fiat. | |
| | ⭐ leading social trading platform, trusted by millions of users from more than 140 countries. ⭐ Wide variety of trading options (crypto, stocks, ETFs, forex, commodities, etc...) ⭐ Copy the trades of top performing traders and portfolios! ⭐ 0% commissions on all stocks! | |
| | ⭐ Legitimate crypto exchange and trading platform. ⭐ Low trading and exchange fees. ⭐ Free practice demo account with 50,000 USDT. ⭐ Make your first deposit and receive a 25 USDT Welcome Bonus. | |
| Disclaimer eToro is a multi-asset platform that offers both investing in stocks and crypto assets, as well as trading CFDs. CFDs are complex instruments and come with a high risk of losing money rapidly due to leverage. 67% of retail investor accounts lose money when trading CFDs with this provider. You should consider whether you understand how CFDs work and whether you can afford to take the high risk of losing your money. Past performance is not an indication of future results. Cryptoassets are volatile instruments that can fluctuate widely and therefore are not appropriate for all investors. Other than via CFDs, trading crypto assets is unregulated and therefore is not supervised by any EU regulatory framework. eToro USA LLC does not offer CFDs. eToro USA LLC makes no representation and assumes no liability as to the accuracy or completeness of the content of this publication. This publication has been prepared by our partner utilizing publicly available non-entity specific information about eToro. | ||
We dedicate our time to making our commentaries educational and insightful so that you can obtain different angles that improve your decision making, so please do show us some love by following us on Twitter and/or Reddit and sharing our commentaries.
Develop your understanding of trading with our free educational guide that walks you through the five rules you need to master before trading crypto.