Flash Alert: Wednesday 24th September
The exodus moments
It has been an adrenaline-filled 24 hours for Bitcoin, with BTCUSDT seen plummeting $1,902 or 20% from its opening level yesterday to hit an intra-day low of $7,800 before bouncing back to the $8,400 – $8,500 levels.
The $7,800 level was last seen on 12th June 2019, and just to put this date into context for you, it is the period before BTCUSDT had rallied a leg up to $13,970.
But for those trading Bitcoin using Binance’s own stablecoin (Binance USD), the volatility was even more fierce!
BTC/BUSD Flash Crash
The price of BTC/BUSD flash crashed by $7,874.42 or 81% from its opening level to a low of $1,800 before regaining ground to $8,400-$8,500.
This happened because of a lack of liquidity (liquidity squeeze) in the BTC/BUSD market. There must have been very low buy orders placed while on the other end numerous people must have placed panic sell orders at the ‘market’ price, resulting in BTC/BUSD getting filled all the way down to $1,800!
The BTC/BUSD event really explains why traders should always place limit orders – and by now you would have understood the importance of limit orders if you had read our educational guide.
Of course the altcoin market wasn’t immune to the selloff in Bitcoin either, with Ether and Litecoin both seen deep in the red with losses over 20% at one point yesterday.
Tether Treasury mints new coins to bolster liquidity
Given the flash crash seen in BTC/BUSD, it is now being reported that the Tether Treasury is minting 15 million Tether (USDT) tokens, valued at around $15 million, in order to raise market liquidity. A sign that suggests the market is expecting further Bitcoin volatility.
Our views prior to the Bitcoin exodus moment
In our Flash Alert yesterday we had warned to ‘never try to catch a falling knife’ as we could clearly see sentiment turning increasingly bearish throughout the trading session.
We had also mentioned that our base case scenario was for BTCUSDT to drift to $9,400 and quite possibly test the critical $9,000 level if support had failed. Although yesterday’s price action was all too fast too furious!
Whilst we could clearly see the bearishness in the cards, the reality is nobody had expected a crash of that magnitude to occur so soon.
So, what caused Bitcoin to crash?
We have already explained the liquidity squeeze in BTC/BUSD but there are many reasons floating around regarding Bitcoin in general.
After all it is all so natural to attribute a cause-and-effect factor to events. It helps our brain make sense out of certain actions and reactions, although at the same time we must be careful to not ascribe the wrong reasons.
Was Bakkt partially the problem?
There has been some talk about the price of Bitcoin breaking down due to disappointment over the lukewarm reception for Bakkt’s physically delivered Bitcoin futures contracts.
Whilst we also expected a stronger reception, the reality is the institutional investor community is still sitting on the sidelines.
The majority of investors rebalance their portfolios quarterly, and bigger changes to portfolio compositions mostly occur between Q4 and Q1 of each year, so we expect to see a rise in demand for Bakkt’s physically delivered Bitcoin futures around that time, and a gradual rise thereafter.
Was it due to a breakdown in hash rate fundamentals?
The hash rate, which is a measure of the computing power of Bitcoin miners, also saw a sharp drop, as you may see from the chart below.
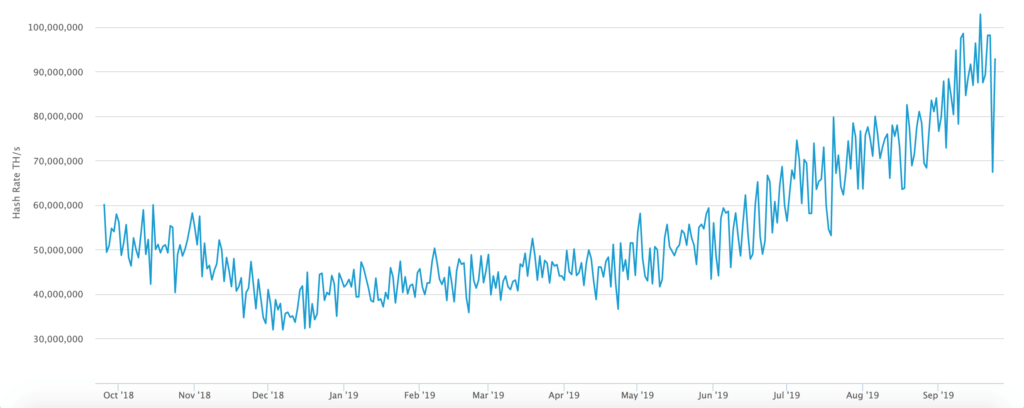
We have come across media reports claiming the drop in the hash rate may have been due to a temporary glitch.
However, we also came across an interesting vlog on Twitter by Jared Tate concerning the growing centralisation of Bitcoin mining pools and mining power, which pose a material threat to Bitcoin.
He explains that currently the Bitcoin blockchain cannot adjust its mining difficulty rate in real-time and that if there is ever a mass power outage or a national disaster affecting pools or a major decrease in the Bitcoin hash rate, block times could stall for hours or potentially weeks, causing immense harm to the industry .
He explains right now afterall there are only three single Bitcoin mining pools and only three unique sets of keys that control 51.2% of Bitcoin mining power.
Jared’s comments resonated with us because we had voiced our concern regarding potential mining collusion on our Twitter feed yesterday, only a few hours before the major selloff took place, as we could not comprehend the vicious price action that we were seeing.
Or perhaps the sell off was simply a result of the key technical levels being breached?
After two-and-a-half months churn within a descending triangle formation, Bitcoin fell below the $9,400 floor of this formation. It later proceeded to descend further and breach the $9,000 pivotal support. So as soon as those support levels failed, it is easy to see how a frenzied wave of panic selling could have triggered margin calls and contract liquidations, exacerbating the volatile swings we saw in Bitcoin yesterday evening.
So where do we stand from here?
Our fundamental research on the hash rate and research into Bitcoin’s performance during previous halving events suggests that Bitcoin is still fundamentally undervalued.
On the other hand, we note the breakdown of the descending triangle is extremely bearish for Bitcoin since it confirms a major top has been established.
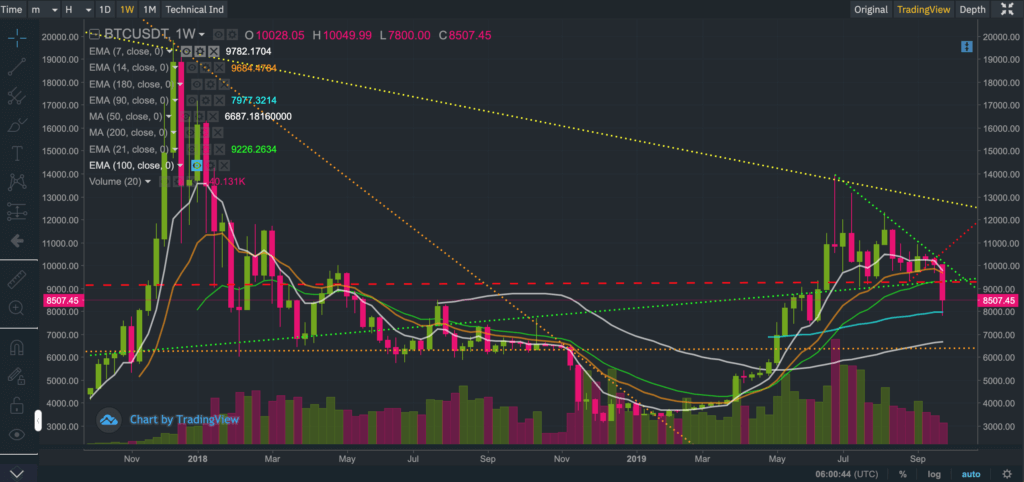
If we zoom out a little and look at the weekly and monthly charts, we can see just how bearish this pattern appears.
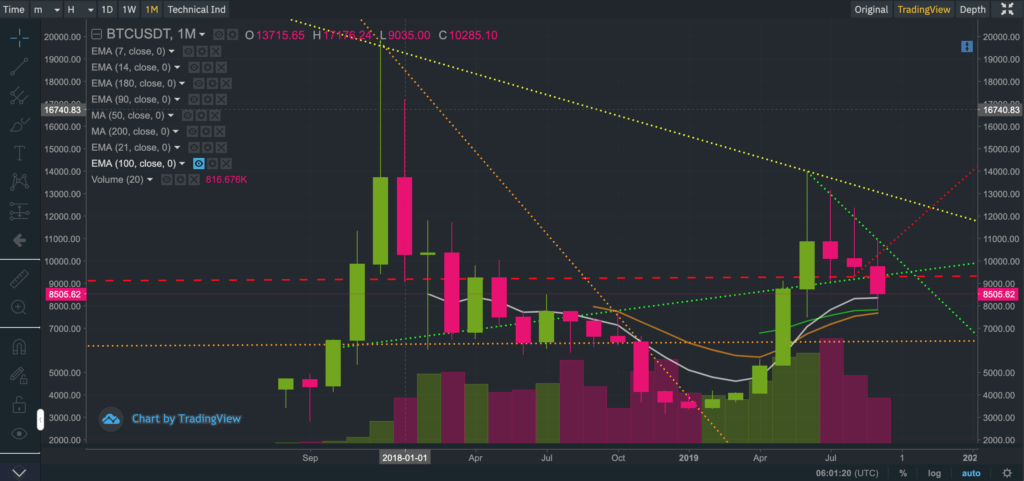
And equally bearish on the monthly charts.
At the time of writing, BTCUSDT was trading between $8,400 and $8,500, well below the 200-day exponential moving average, currently at $8,738.
We are now looking to see whether BTCUSDT can find support and close above the 200-day simple moving average, currently at $8,311.
But as things stand, we are more inclined to believe it is only a matter of time until BTCUSDT closes below the 200-day simple moving average. Let’s not forget it hit a low of $7,800 yesterday and today a low of $8,215 before staging a frail rebound.
We cannot discount the possibility of seeing a short-term bounce in the interim period since the RSI is extremely oversold on the daily chart.
But based on the charts, the trajectory for Bitcoin remains very bearish, and therefore would not be surprised to see prices revert back to levels seen in Q2 of this year. The next critical support level is $7,500 followed by a further knock to $6,200 – $6,500 levels if support at $7,500 fails to hold.
We are a highly self-critical bunch and there are many key learnings from the current Bitcoin event that we will be examining more closely in the days to come, so stay tuned!
Anyone interested in reading our previous Flash Alerts may do so here as they provide a good audit trail of Bitcoin’s recent price action as well as our thinking.
A follow up post to this Flash Alert may be found here.
If you enjoy reading our updates and analysis then start following us on Twitter.
If you’re thinking about trading bitcoin then visit our bitcoin price analysis page. Here we periodically provide interesting bitcoin price insights and analyses that every crypto trader and investor should be aware of.
