Disclaimer: All of the content written on CoinMarketExpert is unbiased and based on objective analysis. The information provided on this page should not be construed as an endorsement of cryptocurrency, a service provider or offering and should neither be considered a solicitation to buy or trade cryptocurrency. Cryptocurrencies carry substantial risk and are not suitable for everyone. No representation or warranty is given as to the accuracy or completeness of this information and consequently, any person acting on it does so entirely at their own risk. See further disclaimer at the bottom of the page.
Flash Alert: Monday 6th April
What happened after our Bitcoin update on 3rd April?
Not much has happened since our previous update on 3rd April. The price of BTCUSDT has been trading mostly sideways above the 7-day moving average although with resistance around the $7,000 region.
Bitcoin managed to find the energy to clear through the $7,000 threshold today with relative ease to hit an intra-day high of $7,188 at the time of writing.
So does the clearing the psychological $7,000 level suggest that Bitcoin is on a solid path to recovery? Not just yet!
So where do we stand from here?
We reiterate the concerns voiced in our previous update on 3rd April and urge our readers to trade very carefully since there are a few red flags that suggest Bitcoin is at risk of another major sell-off.
The price of Bitcoin has continued to rise on falling volumes, which is nearly always a red flag. Furthermore, there appears to be a bearish rising wedge pattern forming.
The weekly chart below appears to illustrate an ascending wedge formation, which is a pattern that has historically proven to be mostly bearish.
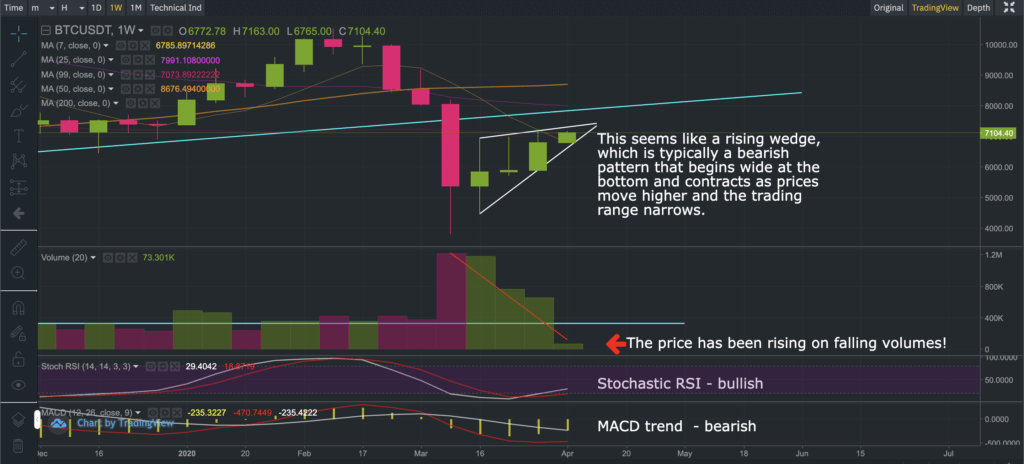
But it is not only the pattern that is concerning us. It is also the ‘buy volumes’, which have been falling as the price of Bitcoin has been rising. The divergence between the price and volume could suggest that a reversal is around the corner.
Of course, we do not have a crystal ball and Bitcoin might even rally further but we thought we should point out these observations.
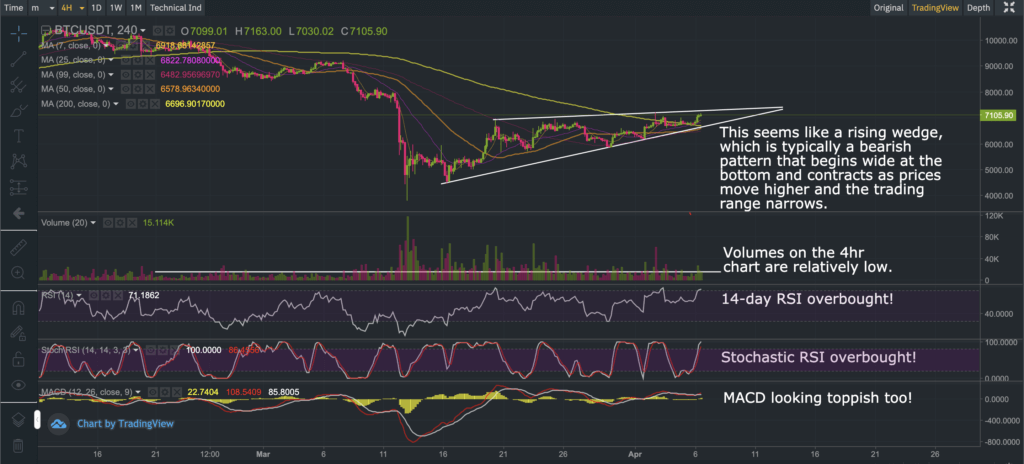
In the meantime, the 4-hour chart seems to suggest that the price of Bitcoin is currently looking a wee bit toppish, as may be seen below.
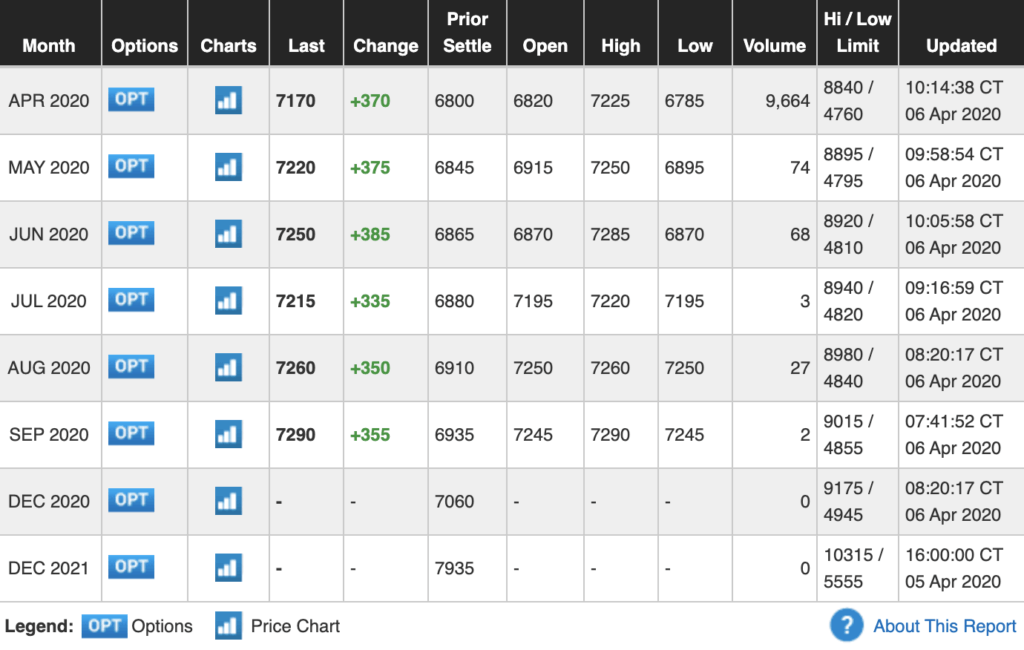
We also point out that the contango on CME Bitcoin futures has flattened somewhat since last week and there appears to be a minor kink forming as well. This could imply indecision over the future price of Bitcoin (or simply be the result of insufficient buy/sell volumes). Either way, it should not be ignored and be viewed in the wider context.
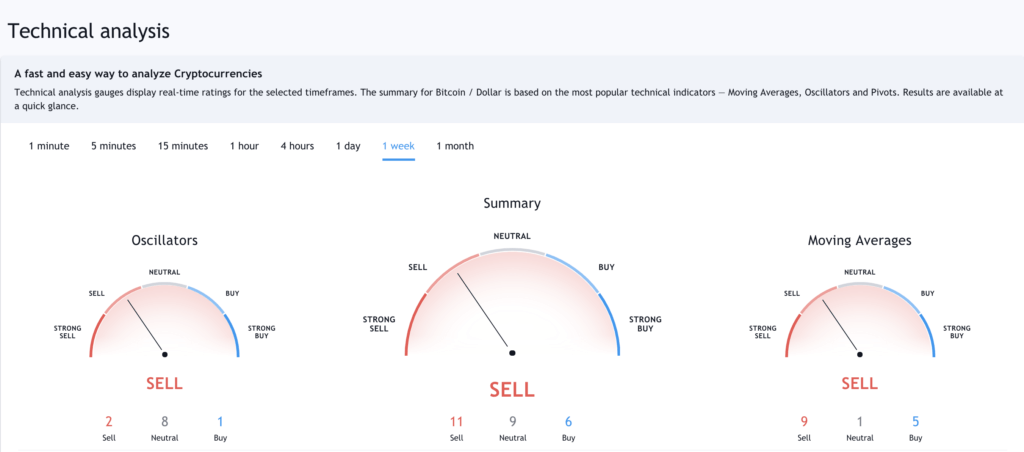
And finally, if we look at the weekly and monthly technicals on Trading View, they seem to point to a possible bearish outcome as well.
So if there are any bulls out there, just be extra careful. Risk management is always uber important!
We hope you found our Bitcoin commentary interesting and educational. As always, trade safely, and at your own risk.
We dedicate our time to making our commentaries educational and insightful so that you can obtain different angles that improve your decision making, so please do show us some love by following us on Twitter and/or Reddit and sharing our commentaries.
The next Bitcoin commentary will be published on Monday 13th April 2020.
If you’re thinking about trading bitcoin then visit our bitcoin price analysis page. Here we periodically provide interesting bitcoin price insights and analyses that every crypto trader and investor should be aware of.
