Flash Alert: Monday 6th January
What happened after our update on 30th December?
Following our update on 30th December, the price of BTCUSDT had dipped from $7,275 to an intra-day low of $6,871 a few days later on 3rd January 2020.
At the time, we had stated three key points:
1. We had observed that Bitcoin had been encountering resistance around the 50-day simple moving average although there was some good support at the 14 and 21 exponential moving averages. We noted that these moving averages appeared to be converging, which meant that Bitcoin has to make a decisive move either to the upside or downside sometime soon;
2. We did not believe Bitcoin had found a bottom, implying we anticipated further downside pressures to resurrect (at the time BTCUSDT was trading at $7,275 and as a matter of fact BTCUSDT did dip to $6,871);
3. We had also stated that for us to become more bullish on the price trajectory of Bitcoin, we would want BTCUSDT to close above $7,400 level and then breach the 50-day moving average of $7,500, which at the time, did not seem very likely.
What are the ‘bull’ and ‘bear’ points for Bitcoin right now?
Investing in Bitcoin isn’t like investing in a publicly-listed company that reports its financials quarterly.
Bitcoin’s fundamentals are its price. We can also look at various operational aspects too such as its hash rate, use cases, adoption rate, mining investment, and so on… But in the greater scheme of things, its the price flows and price trends that are one of the most powerful drivers – and these are driven by a common denominator – which is, to a great extent – sentiment.
Currently, we may see the following “bull” points (in no order of priority):
1. From a price flow perspective, fears of a potential war breaking out with Iran is encouraging investors to seek safe-haven assets such as gold, although digital assets such as Bitcoin may be capturing a proportion of these safe-haven flows as well;
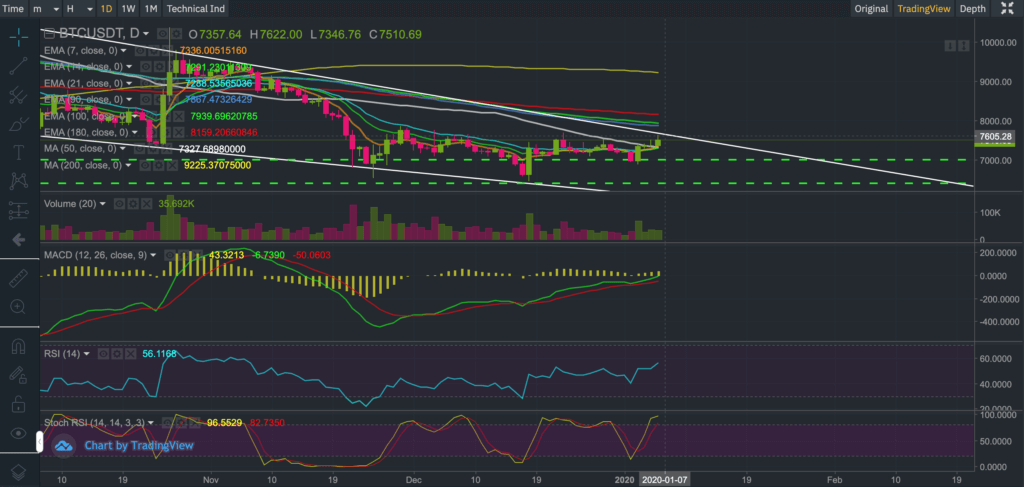
2. From a price trend aspect, BTCUSDT has breached the 50-day moving average, a level where Bitcoin had been recently encountered resistance;
3. We have seen strong buying activity emerge to support the price of Bitcoin whenever it fell between $7,000 and $6,400 (green dotted lines on the chart);
4. The MACD (12,26,9) is becoming progressively bullish;
5. BTCUSDT is moving very close to the channel resistance line (the white descending line that has acted as resistance since June 2019), which if violated, is likely to be extremely bullish for Bitcoin.

You could interpret this pattern as a falling wedge or by simply re-angling the support line, you could also interpret the pattern as a bearish descending channel. Either way, violating the channel resistance line (the white descending line, as seen above) is expected to have bullish implications on the price of Bitcoin – but let’s discuss that if/when it happens.
In the meantime, the ‘bear‘ points we see at the moment are as follows:
1. the overarching price trend remains bearish (the death cross, as denoted by the 50-day and 200-day moving average crossover, continues to move further apart);
2. and from a short term perspective, the 14-day stochastic RSI is providing an oversold signal following a rise of circa $680 from the recent low of $6,871.
So, where do we stand from here?
We are very excited to see BTCUSDT trade above $7,500 right now and are watching intently to see whether the price can close above the channel resistance line. Breaking this line is likely to pave the way for further gains. But even then, it would not be plain sailing because there are numerous moving average hurdles that reside above this level and that would need to be cleared before we can really start to become excited.
So far today, BTCUSDT experienced a fresh bout of selling pressure at around the $7,600 region, preventing it from breaking this channel resistance line. This could suggest that downside pressures may resurface that could pull Bitcoin back down towards the $7,000 level. But who knows what can happen overnight, right?. It’s an interesting period – so we remain on standby!
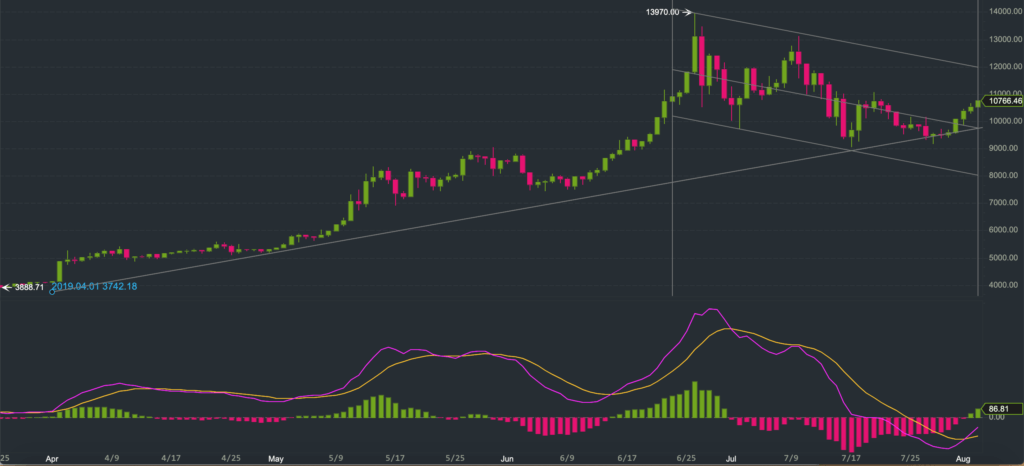
In the greater scheme of things, nobody has a crystal ball. However, if the research we conducted contains any validity – and so far there seems to be some evidence that it does – it could suggest Bitcoin is not too far away from a potential bottom. The research we are referring to is described in a previous Bitcoin update and these observations raise some questions over the risk/reward tradeoff of being a trader versus being a HODLER at the moment.
In other words, a cost averaging approach, picking up small amounts of Bitcoin on the dips, could prove worthy of consideration at this juncture.
At the time of writing today, the price of BTCUSDT was trading at $7,551, up from an earlier intraday low of $7,346 and down from an earlier intraday high of $7,622.
As per our previous updates, we reiterate to our audience that we do not have a crystal ball. We attempt to apply a combination of mathematics, fundamental and technical analysis to our updates to provide you with fresh and unique insights although at the end of the day there are no guarantees.
Our derived price scenarios for Bitcoin may not pan out and therefore we warn our growing audience to tread very carefully and their own risk. Bitcoin is very risky (as you must all know by now) and past performance is not always indicative of the future.
If you enjoy reading our updates and analysis then start following us on Twitter.
The next Bitcoin update will be published on Monday 13th January 2020 and take this opportunity to wish you all a Prosperous New Year!
Anyone interested in reading our previous updates may do so here as they remain valid and provide a good trail for anyone wanting to catch up.
If you’re thinking about trading bitcoin then visit our bitcoin price analysis page. Here we periodically provide interesting bitcoin price insights and analyses that every crypto trader and investor should be aware of.
