Flash Alert: Friday 20th September
It has been an exciting 24 hours, with Bitcoin uncannily bouncing back following a sharp $500 plunge to $9,653 yesterday.
At the time of writing today, BTCUSDT was trading at $10,185 following an earlier intra-day high of $10,281 and low of $10,151.
And currently, BTCUSDT appears trapped between the yellow and green descending lines on the daily chart, as seen below.
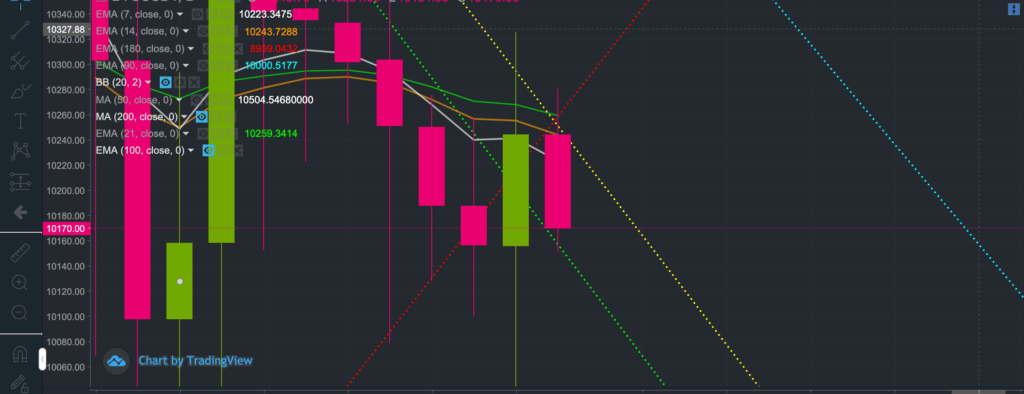
If you want to monitor the price action more closely, we suggest you look at hourly charts, where BTCUSDT appears to be stuck in a tight range between the 7-period simple moving average, currently at $10,185, and its 99-period simple moving average of $10,149.
In our end of day flash alert yesterday, we had stated that we are waiting to see whether BTCUSDT is capable of climbing to its 7, 14, 21 exponential moving averages. These averages now reside between $10,223 – $10,259. It is very clear from the chart above there is still resistance at those levels.
Failing to regain ground above its short term moving averages indicates the bias for Bitcoin still very much remains to the downside at least for now.
If the bears prevail (since that’s where the bias remains at the time of writing) then Bitcoin would slip back towards the 90-day exponential moving average of $10,000. And if it breaches yesterday’s low $9,653, the next point of call would most likely be the $9,400 – $9,500 levels, which are the lows seen at the end of last month.
But with Bakkt launching in just 3 days – on 23rd September – could the market afford to let Bitcoin plunge? Its going to be a very interesting week indeed!
If BTCUSDT nonetheless manages to find support above its short-term exponential moving averages we will most likely see an explosive rally, with the first point of call being the 50-day simple moving average of $10,500.
Depending on where the price goes over the next 24 hours, it will determine whether the MACD turns bullish or bearish; as we may see from the chart below the MACD crossovers are right on the brink of either side.
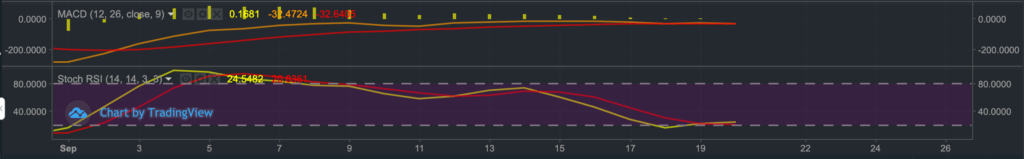
Interestingly, we can see the stochastic RSI is already in oversold territory and the crossovers are now also bullish. If MACD and the stochastic align on the bullish front, a solid rally is very likely to ensue.
Interesting times lay ahead, as the bulls and bears continue to battle it out to the last breathe. So stay tuned!
Anyone interested in reading our previous Flash Alerts may do so here as they continue to remain valid and provide a good trail for anyone wanting to catch up with recent price action.
A follow up post to this Flash Alert may be found here.
If you enjoy reading our updates and analysis then start following us on Twitter.
If you’re thinking about trading bitcoin then visit our bitcoin price analysis page. Here we periodically provide interesting bitcoin price insights and analyses that every crypto trader and investor should be aware of.
