Flash Alert: Thursday 3rd October
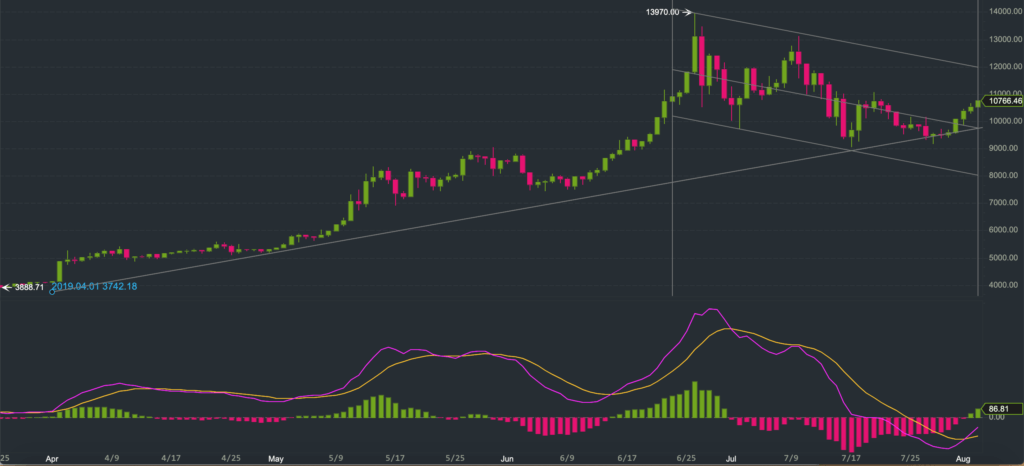
Bitcoin has put up an impressive fight against a bearish tide over the past week although strength has been met with strong selling at critical levels, initially visible at the 200-day moving average and now around the 7-day exponential moving average.
This indicates that sentiment remains skewed to the downside.
Admittedly it is also becoming more difficult to ascertain the intra-day price direction of Bitcoin due to unpredictable swings, so anyone trying to forecast intra-day movements should tread very carefully!
At one point yesterday we felt that BTCUSDT could revisit the $8,000 level although the bulls did eventually prevail, pushing BTCUSDT up to an intra-day high of $8,373.
Today, at the time of writing, BTCUSDT was trading at $8,311.71 following an earlier intra-day high of $8,393 and low of $8,301.
We note the earlier intra-day high was slightly above the 7-day EMA, currently at $8,376.
But Bitcoin’s reluctance to clear the 7-day EMA with ease and find solid turf above the 200-day DMA, currently at $8,483, does very little to quell our short-term bearish view.
And therefore we continue to expect Bitcoin to eventually fall towards the next pivotal support level of $7,500.
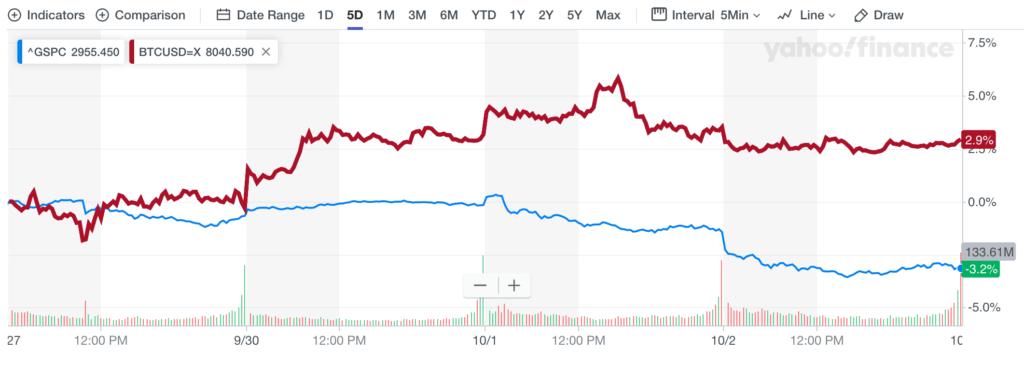
Over the past five days we have observed profit-taking in the S&P 500, and across global stock markets in general, yet at the same time we have also seen Bitcoin (red line) attract some buying support, as may be seen from the chart below.

We wonder whether there has been a proportion of money flowing out of stocks and into Bitcoin or whether the trend is purely coincidental since there are also periods when prices are inversely correlated.
Remember correlations do not always imply causation.
In yesterday’s update we had noted that the VIX, which is a popular measure of the stock market’s expectation of volatility, as implied by S&P 500 index options, appeared inversely correlated with the price of Bitcoin over prolonged periods.
The inverse correlation between the VIX and Bitcoin is not perfect although more consistent over the long term, which helps to dispel the widespread notion that Bitcoin behaves as a safe-haven asset.
It does not mean that Bitcoin cannot become a safe-haven over time nonetheless.
The way these trends are evolving interests us because it provides a deeper understanding as to how Bitcoin is being perceived by the market. And this may in turn help to provide us with clearer trigger points.
We hope you enjoy reading our Bitcoin updates, and anyone interested in reading our previous Flash Alerts may do so here as they remain valid and provide a good trail for anyone wanting to catch up with recent price action.
A follow up post to this Flash Alert may be found here.
If you enjoy reading our updates and analysis then start following us on Twitter.
If you’re thinking about trading bitcoin then visit our bitcoin price analysis page. Here we periodically provide interesting bitcoin price insights and analyses that every crypto trader and investor should be aware of.
